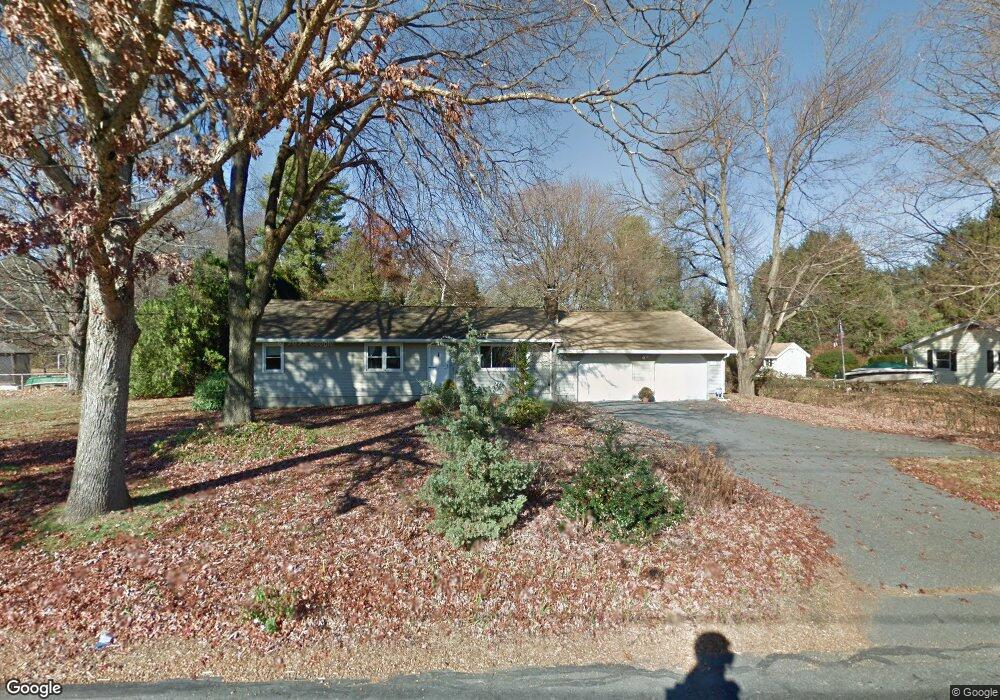
127 Plain St Easthampton, MA 01027
Estimated Value: $360,000 - $408,139
3
Beds
3
Baths
1,176
Sq Ft
$321/Sq Ft
Est. Value
About This Home
This home is located at 127 Plain St, Easthampton, MA 01027 and is currently estimated at $377,285, approximately $320 per square foot. 127 Plain St is a home located in Hampshire County with nearby schools including Easthampton High School, Tri-County Schools, and New England Adolescent Research Institute.
Ownership History
Date
Name
Owned For
Owner Type
Purchase Details
Closed on
Jan 25, 2013
Sold by
Kowal Elizabeth A Est
Bought by
Hutchinson Richard H and Hutchinson Mary R
Current Estimated Value
Purchase Details
Closed on
May 25, 2005
Sold by
Hutchinson Richard H
Bought by
Hutchinson Mary R and Hutchinson Richard H
Create a Home Valuation Report for This Property
The Home Valuation Report is an in-depth analysis detailing your home's value as well as a comparison with similar homes in the area
Home Values in the Area
Average Home Value in this Area
Purchase History
| Date | Buyer | Sale Price | Title Company |
|---|---|---|---|
| Hutchinson Richard H | -- | -- | |
| Hutchinson Mary R | -- | -- |
Source: Public Records
Mortgage History
| Date | Status | Borrower | Loan Amount |
|---|---|---|---|
| Previous Owner | Hutchinson Richard H | $50,000 | |
| Previous Owner | Hutchinson Richard H | $21,000 |
Source: Public Records
Tax History
| Year | Tax Paid | Tax Assessment Tax Assessment Total Assessment is a certain percentage of the fair market value that is determined by local assessors to be the total taxable value of land and additions on the property. | Land | Improvement |
|---|---|---|---|---|
| 2025 | $4,678 | $342,200 | $119,300 | $222,900 |
| 2024 | $4,515 | $333,000 | $115,700 | $217,300 |
| 2023 | $3,454 | $235,800 | $91,700 | $144,100 |
| 2022 | $3,898 | $235,800 | $91,700 | $144,100 |
| 2021 | $899 | $242,800 | $91,700 | $151,100 |
| 2020 | $867 | $235,800 | $91,700 | $144,100 |
| 2019 | $852 | $227,300 | $91,700 | $135,600 |
| 2018 | $3,374 | $210,900 | $86,500 | $124,400 |
| 2017 | $811 | $203,300 | $83,200 | $120,100 |
| 2016 | $3,419 | $219,300 | $83,200 | $136,100 |
| 2015 | $3,322 | $219,300 | $83,200 | $136,100 |
Source: Public Records
Map
Nearby Homes
Your Personal Tour Guide
Ask me questions while you tour the home.