Estimated Value: $291,000 - $354,000
3
Beds
3
Baths
1,996
Sq Ft
$158/Sq Ft
Est. Value
About This Home
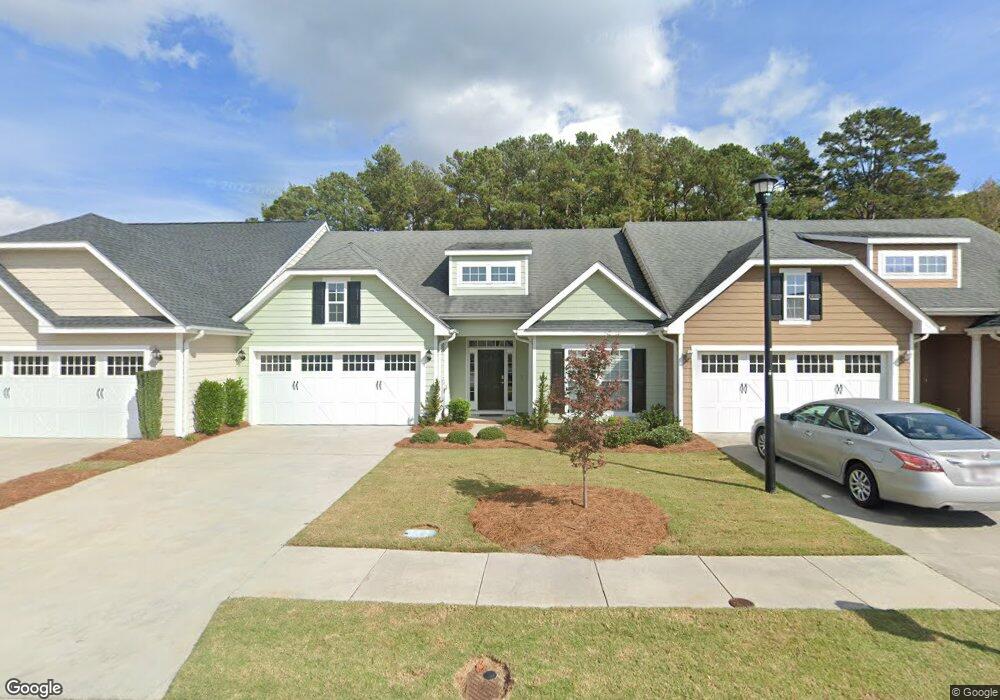
This home is located at 127 Preakness Dr, Evans, GA 30809 and is currently estimated at $314,828, approximately $157 per square foot. 127 Preakness Dr is a home located in Columbia County with nearby schools including Blue Ridge Elementary School, Lakeside Middle School, and Lakeside High School.
Ownership History
Date
Name
Owned For
Owner Type
Purchase Details
Closed on
Nov 13, 2017
Sold by
Baker Freda F
Bought by
Davis Jonathan Ford
Current Estimated Value
Home Financials for this Owner
Home Financials are based on the most recent Mortgage that was taken out on this home.
Original Mortgage
$123,000
Outstanding Balance
$102,987
Interest Rate
3.91%
Mortgage Type
New Conventional
Estimated Equity
$211,841
Purchase Details
Closed on
Dec 20, 2012
Sold by
Owens Michael A
Bought by
Baker Freda F
Home Financials for this Owner
Home Financials are based on the most recent Mortgage that was taken out on this home.
Original Mortgage
$113,150
Interest Rate
4%
Mortgage Type
New Conventional
Purchase Details
Closed on
Jun 29, 2007
Sold by
Steeplechase Keystone Llc
Bought by
Owens Michael A
Home Financials for this Owner
Home Financials are based on the most recent Mortgage that was taken out on this home.
Original Mortgage
$193,276
Interest Rate
6.37%
Mortgage Type
FHA
Create a Home Valuation Report for This Property
The Home Valuation Report is an in-depth analysis detailing your home's value as well as a comparison with similar homes in the area
Home Values in the Area
Average Home Value in this Area
Purchase History
| Date | Buyer | Sale Price | Title Company |
|---|---|---|---|
| Davis Jonathan Ford | $198,000 | -- | |
| Baker Freda F | $146,000 | -- | |
| Owens Michael A | $196,400 | -- |
Source: Public Records
Mortgage History
| Date | Status | Borrower | Loan Amount |
|---|---|---|---|
| Open | Davis Jonathan Ford | $123,000 | |
| Previous Owner | Baker Freda F | $113,150 | |
| Previous Owner | Owens Michael A | $193,276 |
Source: Public Records
Tax History
| Year | Tax Paid | Tax Assessment Tax Assessment Total Assessment is a certain percentage of the fair market value that is determined by local assessors to be the total taxable value of land and additions on the property. | Land | Improvement |
|---|---|---|---|---|
| 2025 | $2,798 | $114,884 | $21,604 | $93,280 |
| 2024 | $2,915 | $114,323 | $20,504 | $93,819 |
| 2023 | $2,915 | $108,674 | $20,504 | $88,170 |
| 2022 | $2,488 | $93,483 | $16,204 | $77,279 |
| 2021 | $2,478 | $88,978 | $15,504 | $73,474 |
| 2020 | $2,467 | $86,732 | $15,104 | $71,628 |
| 2019 | $2,315 | $81,262 | $15,604 | $65,658 |
| 2018 | $2,171 | $75,814 | $14,404 | $61,410 |
| 2017 | $2,088 | $74,512 | $13,404 | $61,108 |
| 2016 | $2,036 | $75,337 | $12,480 | $62,857 |
| 2015 | $1,946 | $69,902 | $12,580 | $57,322 |
| 2014 | $1,863 | $65,972 | $12,280 | $53,692 |
Source: Public Records
Map
Nearby Homes
- 1956 Avenel Ln
- 7311 Malton Ct
- 615 Jones Landing Ct
- 7304 Malton Ct
- 541 Meldon Rd
- 511 Seminole Place
- 507 Meldon Rd
- 652 King Taylor Rd
- 3830 Honors Way
- 310 Ash Ct
- 3815 Forest Creek Way
- 4020 Firethorn Ct
- 2025 Grace Ave
- 2 Winged Foot Dr
- 526 Oak Chase Dr
- 615 Baytree Ct
- 3832 Forest Creek Way
- 3829 Villa Ln
- 619 Baytree Ct
- 3814 Villa Ct
- 125 Preakness Dr
- 129 Preakness Dr
- 123 Preakness Dr
- 131 Preakness Dr
- 133 Preakness Dr
- 121 Preakness Dr
- 130 Preakness Dr
- 132 Preakness Dr
- 202 Full Circle Dr
- 135 Preakness Dr
- 134 Preakness Dr
- 204 Full Circle Dr
- 136 Preakness Dr
- 137 Preakness Dr
- 117 Preakness Dr
- 211 Full Circle Dr
- 206 Full Circle Dr
- 138 Preakness Dr
- 115 Preakness Dr
- 213 Full Circle Dr
Your Personal Tour Guide
Ask me questions while you tour the home.