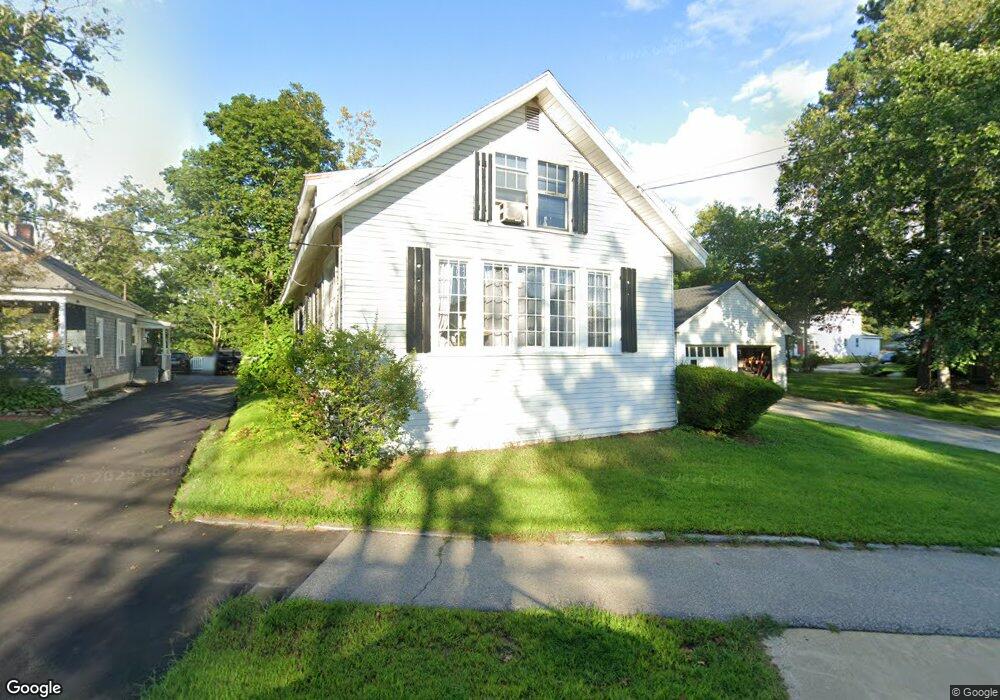
127 South St Concord, NH 03301
South End NeighborhoodEstimated Value: $478,000 - $534,000
4
Beds
2
Baths
1,726
Sq Ft
$292/Sq Ft
Est. Value
About This Home
This home is located at 127 South St, Concord, NH 03301 and is currently estimated at $503,932, approximately $291 per square foot. 127 South St is a home located in Merrimack County with nearby schools including Abbot-Downing School, Rundlett Middle School, and Concord High School.
Ownership History
Date
Name
Owned For
Owner Type
Purchase Details
Closed on
Apr 24, 1997
Sold by
Williams Robert W and Williams Doris M
Bought by
Greene Benjamin T and Greene Faith E
Current Estimated Value
Home Financials for this Owner
Home Financials are based on the most recent Mortgage that was taken out on this home.
Original Mortgage
$52,000
Interest Rate
7.77%
Mortgage Type
Purchase Money Mortgage
Create a Home Valuation Report for This Property
The Home Valuation Report is an in-depth analysis detailing your home's value as well as a comparison with similar homes in the area
Home Values in the Area
Average Home Value in this Area
Purchase History
| Date | Buyer | Sale Price | Title Company |
|---|---|---|---|
| Greene Benjamin T | $92,000 | -- |
Source: Public Records
Mortgage History
| Date | Status | Borrower | Loan Amount |
|---|---|---|---|
| Open | Greene Benjamin T | $255,500 | |
| Closed | Greene Benjamin T | $52,000 |
Source: Public Records
Tax History Compared to Growth
Tax History
| Year | Tax Paid | Tax Assessment Tax Assessment Total Assessment is a certain percentage of the fair market value that is determined by local assessors to be the total taxable value of land and additions on the property. | Land | Improvement |
|---|---|---|---|---|
| 2024 | $8,598 | $310,500 | $113,100 | $197,400 |
| 2023 | $8,340 | $310,500 | $113,100 | $197,400 |
| 2022 | $8,039 | $310,500 | $113,100 | $197,400 |
| 2021 | $7,847 | $312,400 | $113,100 | $199,300 |
| 2020 | $7,632 | $285,200 | $89,600 | $195,600 |
| 2019 | $7,101 | $255,600 | $87,900 | $167,700 |
| 2018 | $4,503 | $244,900 | $87,900 | $157,000 |
| 2017 | $6,594 | $233,500 | $87,900 | $145,600 |
| 2016 | $6,256 | $226,100 | $86,200 | $139,900 |
| 2015 | $5,922 | $214,000 | $90,000 | $124,000 |
| 2014 | -- | $214,000 | $90,000 | $124,000 |
| 2013 | -- | $214,000 | $90,000 | $124,000 |
| 2012 | -- | $218,800 | $90,000 | $128,800 |
Source: Public Records
Map
Nearby Homes
- 122 South St
- 0 South St Unit 4969509
- 12 Avon St
- 15 Wilson Ave
- 22 Wilson Ave
- 105 S Main St
- 33 Spruce St
- 0 Spruce St Unit 88
- 24 Badger St
- 47 South St
- 14 Downing St
- 376 S Main St
- 14-16 Perley St
- 10 Perley St
- 289 South St
- 87 S Main St Unit 2
- 4 Fayette St
- 2 Kensington Rd
- 54 Pleasant St Unit 8
- 53 Heather Ln