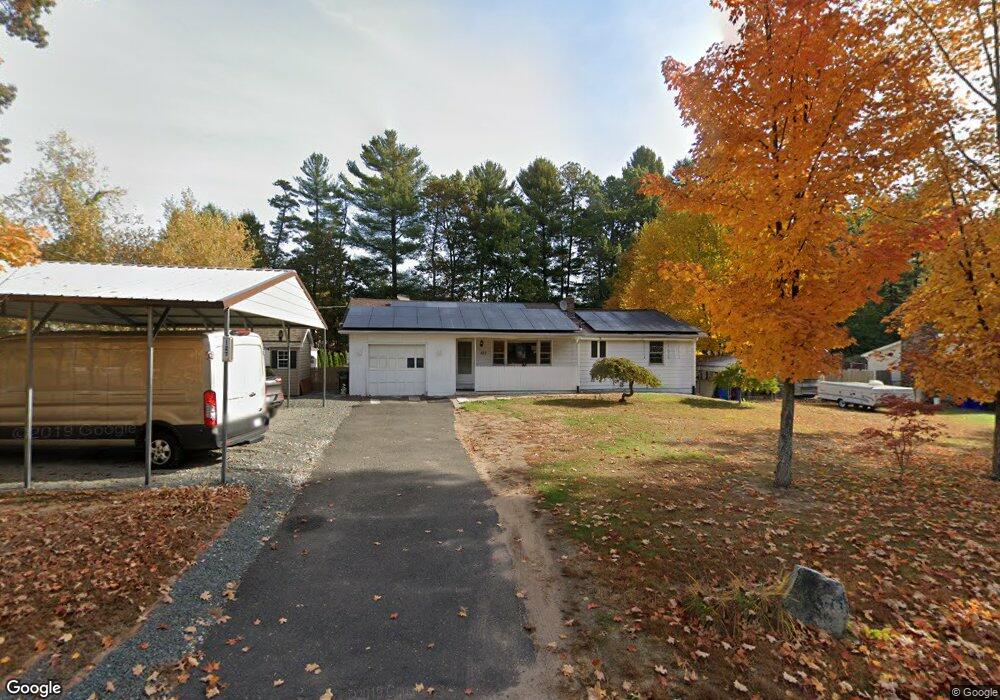
127 Strong St Easthampton, MA 01027
Estimated Value: $317,307 - $363,000
2
Beds
3
Baths
912
Sq Ft
$379/Sq Ft
Est. Value
About This Home
This home is located at 127 Strong St, Easthampton, MA 01027 and is currently estimated at $345,577, approximately $378 per square foot. 127 Strong St is a home located in Hampshire County with nearby schools including Easthampton High School, Calvary Baptist Christian School, and Tri-County Schools.
Ownership History
Date
Name
Owned For
Owner Type
Purchase Details
Closed on
Sep 1, 1994
Sold by
Bielinski Stella M and Discenza John M
Bought by
Ulrich Brenda J and Ulrich Richard C
Current Estimated Value
Home Financials for this Owner
Home Financials are based on the most recent Mortgage that was taken out on this home.
Original Mortgage
$77,900
Interest Rate
8.44%
Mortgage Type
Purchase Money Mortgage
Create a Home Valuation Report for This Property
The Home Valuation Report is an in-depth analysis detailing your home's value as well as a comparison with similar homes in the area
Home Values in the Area
Average Home Value in this Area
Purchase History
| Date | Buyer | Sale Price | Title Company |
|---|---|---|---|
| Ulrich Brenda J | $82,000 | -- |
Source: Public Records
Mortgage History
| Date | Status | Borrower | Loan Amount |
|---|---|---|---|
| Open | Ulrich Brenda J | $40,000 | |
| Closed | Ulrich Brenda J | $77,900 |
Source: Public Records
Tax History
| Year | Tax Paid | Tax Assessment Tax Assessment Total Assessment is a certain percentage of the fair market value that is determined by local assessors to be the total taxable value of land and additions on the property. | Land | Improvement |
|---|---|---|---|---|
| 2025 | $3,834 | $280,500 | $111,600 | $168,900 |
| 2024 | $3,699 | $272,800 | $108,300 | $164,500 |
| 2023 | $2,845 | $194,200 | $85,800 | $108,400 |
| 2022 | $3,210 | $194,200 | $85,800 | $108,400 |
| 2021 | $3,501 | $199,600 | $85,800 | $113,800 |
| 2020 | $3,449 | $194,200 | $85,800 | $108,400 |
| 2019 | $2,903 | $187,800 | $85,800 | $102,000 |
| 2018 | $2,790 | $174,400 | $81,100 | $93,300 |
| 2017 | $2,722 | $167,900 | $77,800 | $90,100 |
| 2016 | $2,618 | $167,900 | $77,800 | $90,100 |
| 2015 | $2,544 | $167,900 | $77,800 | $90,100 |
Source: Public Records
Map
Nearby Homes
Your Personal Tour Guide
Ask me questions while you tour the home.