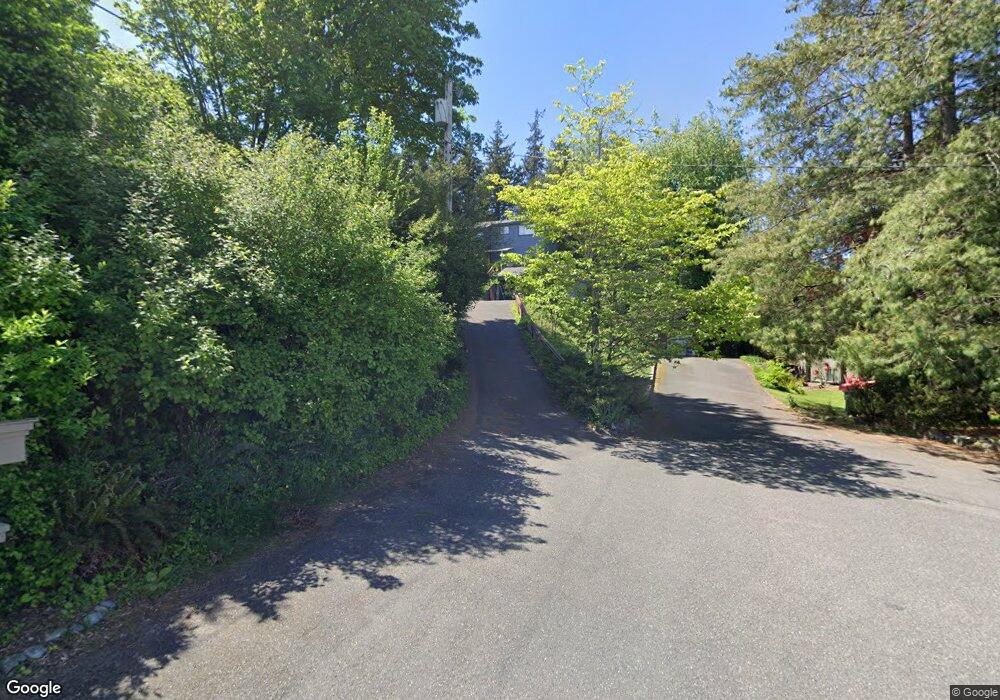
127 Underhill Rd Bellingham, WA 98225
Edgemoor NeighborhoodEstimated Value: $946,000 - $1,363,000
3
Beds
3
Baths
2,410
Sq Ft
$509/Sq Ft
Est. Value
About This Home
This home is located at 127 Underhill Rd, Bellingham, WA 98225 and is currently estimated at $1,227,711, approximately $509 per square foot. 127 Underhill Rd is a home located in Whatcom County with nearby schools including Happy Valley Elementary School, Fairhaven Middle School, and Sehome High School.
Ownership History
Date
Name
Owned For
Owner Type
Purchase Details
Closed on
Jan 26, 2010
Sold by
Jones Noah J and Jones Kelly M
Bought by
Worden Eric J and Mcgowan Andrea K
Current Estimated Value
Home Financials for this Owner
Home Financials are based on the most recent Mortgage that was taken out on this home.
Original Mortgage
$300,000
Outstanding Balance
$197,354
Interest Rate
4.91%
Mortgage Type
New Conventional
Estimated Equity
$1,030,357
Purchase Details
Closed on
Apr 24, 2007
Sold by
Austin Daniel E and Austin Sandra L
Bought by
Jones Noah J and Matheson Kelly
Home Financials for this Owner
Home Financials are based on the most recent Mortgage that was taken out on this home.
Original Mortgage
$223,000
Interest Rate
5.88%
Mortgage Type
Stand Alone Second
Create a Home Valuation Report for This Property
The Home Valuation Report is an in-depth analysis detailing your home's value as well as a comparison with similar homes in the area
Home Values in the Area
Average Home Value in this Area
Purchase History
| Date | Buyer | Sale Price | Title Company |
|---|---|---|---|
| Worden Eric J | $490,280 | Stewart Title Company | |
| Jones Noah J | $640,280 | Stewart Title Company |
Source: Public Records
Mortgage History
| Date | Status | Borrower | Loan Amount |
|---|---|---|---|
| Open | Worden Eric J | $300,000 | |
| Previous Owner | Jones Noah J | $223,000 | |
| Previous Owner | Jones Noah J | $417,000 |
Source: Public Records
Tax History Compared to Growth
Tax History
| Year | Tax Paid | Tax Assessment Tax Assessment Total Assessment is a certain percentage of the fair market value that is determined by local assessors to be the total taxable value of land and additions on the property. | Land | Improvement |
|---|---|---|---|---|
| 2024 | $8,360 | $1,037,491 | $549,055 | $488,436 |
| 2023 | $8,360 | $1,074,584 | $568,685 | $505,899 |
| 2022 | $6,885 | $914,545 | $483,990 | $430,555 |
| 2021 | $6,541 | $737,556 | $390,325 | $347,231 |
| 2020 | $6,427 | $646,974 | $342,388 | $304,586 |
| 2019 | $6,325 | $614,118 | $325,000 | $289,118 |
| 2018 | $6,540 | $606,068 | $303,258 | $302,810 |
| 2017 | $5,769 | $537,969 | $269,180 | $268,789 |
| 2016 | $5,252 | $495,338 | $247,680 | $247,658 |
| 2015 | $5,169 | $469,759 | $234,780 | $234,979 |
| 2014 | -- | $447,379 | $223,600 | $223,779 |
| 2013 | -- | $426,312 | $215,000 | $211,312 |
Source: Public Records
Map
Nearby Homes
- 406 Willow Road Place
- 404 Willow Road Place
- 214 Bayside Rd
- 505 Willow Rd
- 507 Lyla Ln
- 331 Chuckanut Dr N
- 425 Chuckanut Dr N Unit 5
- 1301 Broad St
- 1212 Old Fairhaven Pkwy Unit D202
- 707 Donovan Ave
- 2600 16th St
- 405 Bayside Rd
- 1302 Larrabee Ave
- 910 Harris Ave Unit 208
- 910 Harris Ave Unit 304
- 624 Clark Rd
- 1605 Donovan Ave
- 30 Shorewood Dr
- 1315 Mill Ave
- 1100 12th St
- 125 Underhill Rd
- 426 Parkridge Rd
- 128 Underhill Rd
- 430 Parkridge Rd
- 118 Hawthorne Rd
- 420 Parkridge Rd
- 124 Underhill Rd
- 116 Hawthorne Rd
- 112 Hawthorne Rd
- 120 Underhill Rd
- 110 Hawthorne Rd
- 412 Parkridge Rd
- 117 Underhill Rd
- 408 Parkridge Rd
- 431 Parkridge Rd
- 115 Underhill Rd
- 425 Parkridge Rd
- 120 Hawthorne Rd
- 404 Parkridge Rd
- 421 Parkridge Rd