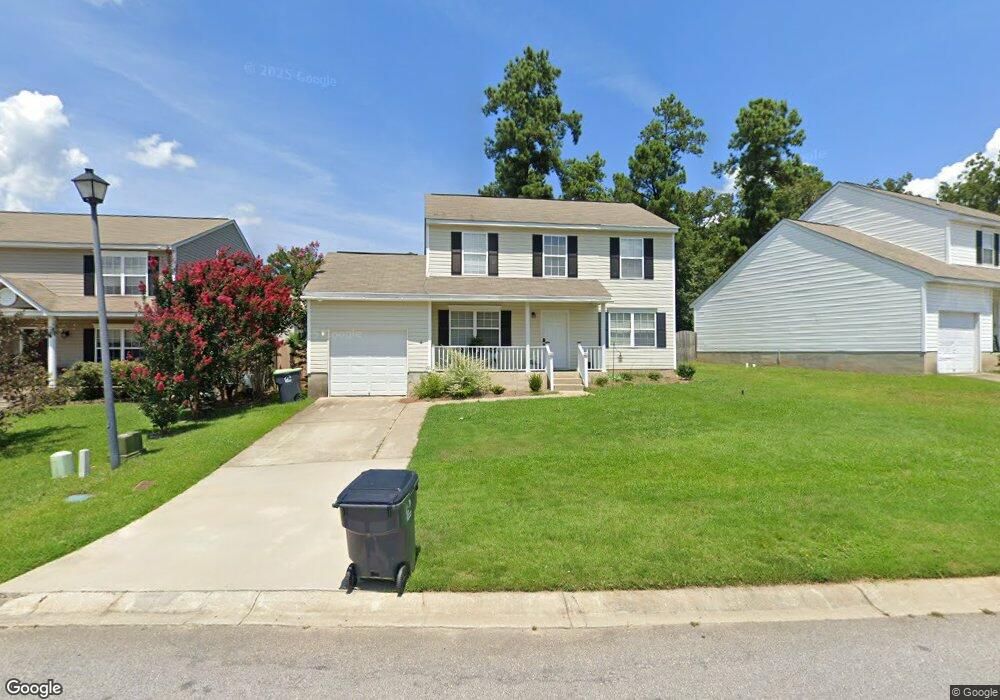
127 Walkbridge Way Chapin, SC 29036
Estimated Value: $206,000 - $241,806
3
Beds
3
Baths
1,560
Sq Ft
$147/Sq Ft
Est. Value
About This Home
This home is located at 127 Walkbridge Way, Chapin, SC 29036 and is currently estimated at $229,952, approximately $147 per square foot. 127 Walkbridge Way is a home located in Lexington County with nearby schools including Chapin Elementary School, Chapin Intermediate, and Chapin High School.
Ownership History
Date
Name
Owned For
Owner Type
Purchase Details
Closed on
Jul 31, 2015
Sold by
Leiby Brian Clark and Leiby Kathleen Mary
Bought by
Bartley Amy E
Current Estimated Value
Home Financials for this Owner
Home Financials are based on the most recent Mortgage that was taken out on this home.
Original Mortgage
$112,917
Outstanding Balance
$90,202
Interest Rate
4.5%
Mortgage Type
FHA
Estimated Equity
$139,750
Purchase Details
Closed on
Feb 10, 2006
Sold by
Nvr Rymarc Homes Of South Carolina Llc
Bought by
Leiby Brian Clark and Leiby Kathleen Mary
Home Financials for this Owner
Home Financials are based on the most recent Mortgage that was taken out on this home.
Original Mortgage
$62,185
Interest Rate
6.14%
Mortgage Type
New Conventional
Create a Home Valuation Report for This Property
The Home Valuation Report is an in-depth analysis detailing your home's value as well as a comparison with similar homes in the area
Home Values in the Area
Average Home Value in this Area
Purchase History
| Date | Buyer | Sale Price | Title Company |
|---|---|---|---|
| Bartley Amy E | $115,000 | -- | |
| Leiby Brian Clark | $105,585 | None Available |
Source: Public Records
Mortgage History
| Date | Status | Borrower | Loan Amount |
|---|---|---|---|
| Open | Bartley Amy E | $112,917 | |
| Previous Owner | Leiby Brian Clark | $62,185 |
Source: Public Records
Tax History Compared to Growth
Tax History
| Year | Tax Paid | Tax Assessment Tax Assessment Total Assessment is a certain percentage of the fair market value that is determined by local assessors to be the total taxable value of land and additions on the property. | Land | Improvement |
|---|---|---|---|---|
| 2024 | $871 | $5,290 | $965 | $4,325 |
| 2023 | $809 | $5,290 | $965 | $4,325 |
| 2020 | $855 | $5,290 | $965 | $4,325 |
| 2019 | $757 | $4,600 | $800 | $3,800 |
| 2018 | $666 | $4,600 | $800 | $3,800 |
| 2017 | $649 | $4,600 | $800 | $3,800 |
| 2016 | $665 | $4,600 | $800 | $3,800 |
| 2014 | $647 | $4,490 | $800 | $3,690 |
| 2013 | -- | $4,490 | $800 | $3,690 |
Source: Public Records
Map
Nearby Homes
- 100 Palm St
- 117 Bay Front Dr
- 0 Dreher Island Rd Unit 21647709
- 0 Dreher Island Rd Unit 587193
- 510 Lilypad Ct
- 3006 Chilmark Rd
- 409 Dutchman Shores Cir
- 171 Elm Creek Dr
- 161 Dutchman Shores Cir
- 147 Ventnor Ave
- 108 Pennsylvania Ct
- 125 Northshore Dr
- 100 Baltic Ct
- 814 Dutchmaster Dr
- 1431 Saugus Ct
- 417 Northshore Ct
- 129 Monroe Preserve Dr
- 412 Northshore Ct
- 0 Mainsail Ln Unit 622256
- 147 Stuck's Point
- 121 Walkbridge Way
- 133 Walkbridge Way
- 283 Walkbridge Way
- 139 Walkbridge Way
- 275 Walkbridge Way
- 126 Walkbridge Way
- 130 Walkbridge Way
- 122 Walkbridge Way
- 134 Walkbridge Way
- 118 Walkbridge Way
- 145 Walkbridge Way
- 138 Walkbridge Way
- 271 Walkbridge Way
- 114 Walkbridge Way
- 107 Walkbridge Way
- 142 Walkbridge Way
- 110 Walkbridge Way
- 284 Walkbridge Way
- 146 Walkbridge Way
- 5 Walkbridge Ct