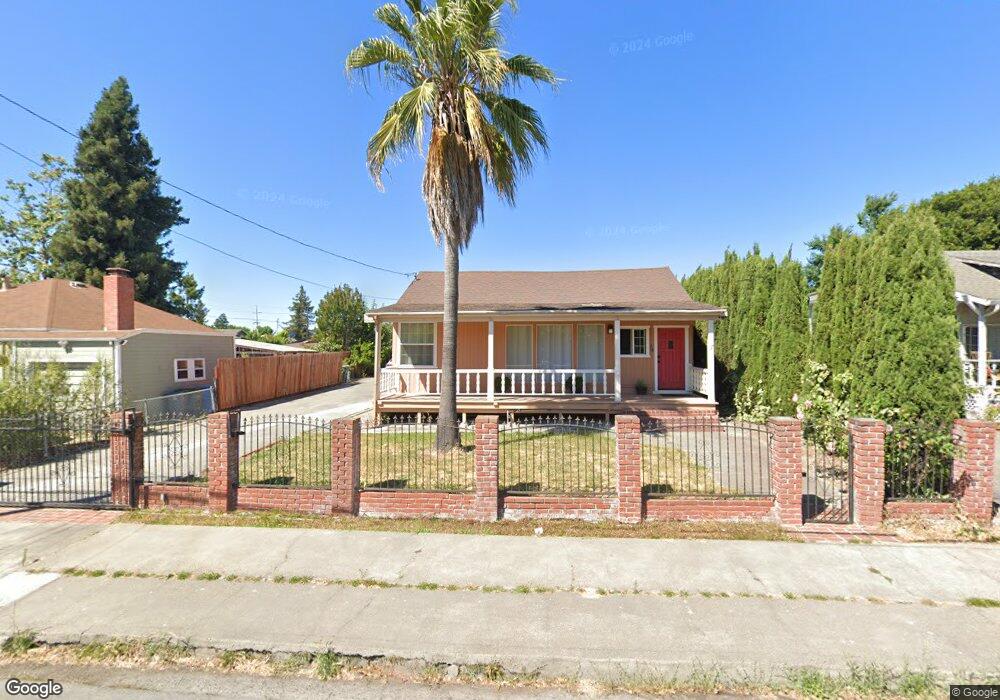
127 Wilson St Petaluma, CA 94952
Midtown NeighborhoodEstimated Value: $836,000 - $1,208,000
3
Beds
2
Baths
1,682
Sq Ft
$580/Sq Ft
Est. Value
About This Home
This home is located at 127 Wilson St, Petaluma, CA 94952 and is currently estimated at $975,978, approximately $580 per square foot. 127 Wilson St is a home located in Sonoma County with nearby schools including McKinley Elementary School, Petaluma Junior High School, and Petaluma High School.
Ownership History
Date
Name
Owned For
Owner Type
Purchase Details
Closed on
May 8, 2024
Sold by
Wdda Llc
Bought by
Escamilla Elba
Current Estimated Value
Purchase Details
Closed on
May 6, 2024
Sold by
Escamilla Elba
Bought by
Escamilla Roberto and Escamilla Elba
Purchase Details
Closed on
May 20, 2010
Sold by
Escamilla Keiri Y and Escamilla Roberto
Bought by
Wdda Llc
Purchase Details
Closed on
Feb 9, 2009
Sold by
Escamilla Roberto and Escamilla Elba
Bought by
Acosta Munoz Keiri Y Escamilla and Acosta Ruiz Luis A
Purchase Details
Closed on
Sep 8, 1999
Sold by
Holmes Germane C and Holmes Susan A
Bought by
Escamilla Roberto and Escamilla Elba
Home Financials for this Owner
Home Financials are based on the most recent Mortgage that was taken out on this home.
Original Mortgage
$161,000
Interest Rate
7.89%
Mortgage Type
Stand Alone First
Create a Home Valuation Report for This Property
The Home Valuation Report is an in-depth analysis detailing your home's value as well as a comparison with similar homes in the area
Home Values in the Area
Average Home Value in this Area
Purchase History
| Date | Buyer | Sale Price | Title Company |
|---|---|---|---|
| Escamilla Elba | -- | None Listed On Document | |
| Escamilla Roberto | -- | None Listed On Document | |
| Wdda Llc | -- | None Available | |
| Acosta Munoz Keiri Y Escamilla | -- | None Available | |
| Escamilla Roberto | $230,000 | North Bay Title Co |
Source: Public Records
Mortgage History
| Date | Status | Borrower | Loan Amount |
|---|---|---|---|
| Previous Owner | Escamilla Roberto | $161,000 | |
| Closed | Escamilla Roberto | $46,000 |
Source: Public Records
Tax History
| Year | Tax Paid | Tax Assessment Tax Assessment Total Assessment is a certain percentage of the fair market value that is determined by local assessors to be the total taxable value of land and additions on the property. | Land | Improvement |
|---|---|---|---|---|
| 2025 | $4,946 | $448,400 | $192,170 | $256,230 |
| 2024 | $4,946 | $439,608 | $188,402 | $251,206 |
| 2023 | $4,946 | $430,989 | $184,708 | $246,281 |
| 2022 | $4,761 | $422,539 | $181,087 | $241,452 |
| 2021 | $4,673 | $414,255 | $177,537 | $236,718 |
| 2020 | $4,712 | $410,008 | $175,717 | $234,291 |
| 2019 | $4,655 | $401,970 | $172,272 | $229,698 |
| 2018 | $4,638 | $394,090 | $168,895 | $225,195 |
| 2017 | $4,542 | $386,364 | $165,584 | $220,780 |
| 2016 | $4,432 | $378,789 | $162,338 | $216,451 |
| 2015 | $4,372 | $373,100 | $159,900 | $213,200 |
| 2014 | $4,351 | $365,792 | $156,768 | $209,024 |
Source: Public Records
Map
Nearby Homes
- 591 Madison St
- 66 Rio Vista Way
- 712 E Washington St
- 316 Vallejo St
- 320 Vallejo St
- 512 Kentucky St
- 930 Martin Cir
- 0 Lakeville St
- 315 Lakeville St
- 142 Cherry St
- 131 Liberty St
- 426 1st St
- 136 Court St
- 12 Rain Tree Ct
- 101 Arlington Dr
- 65 Freedom Ln N
- 1252 Petaluma Blvd N
- 111 Acorn Dr
- 618 E St
- 1321 Mcneil Ave
Your Personal Tour Guide
Ask me questions while you tour the home.