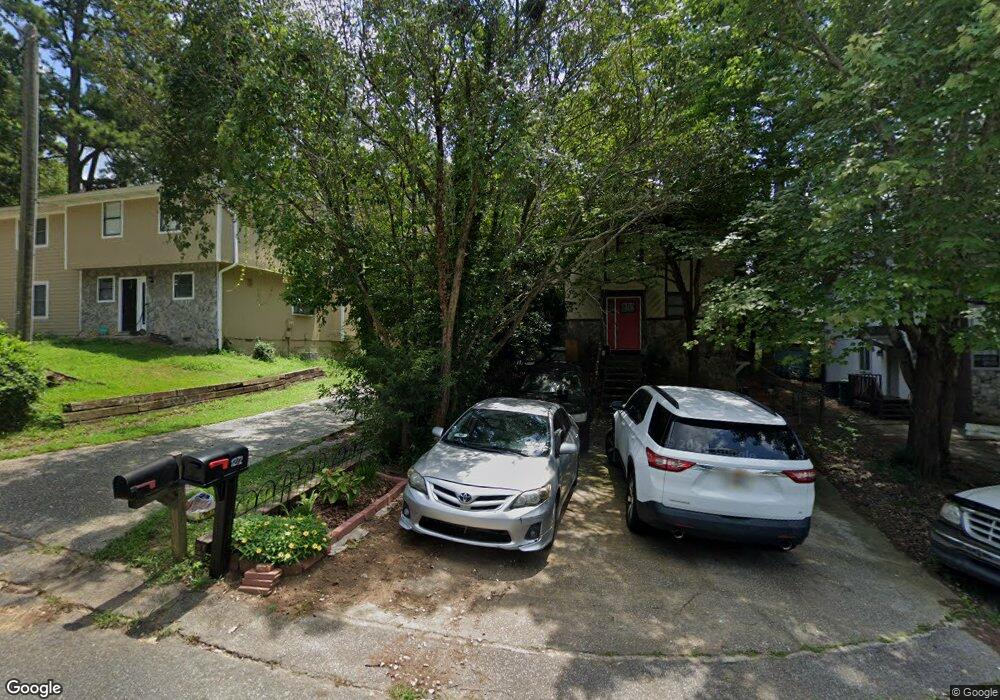
1270 Creekside Ct SE Unit 3 Smyrna, GA 30080
Estimated Value: $199,000 - $266,000
2
Beds
3
Baths
1,080
Sq Ft
$221/Sq Ft
Est. Value
About This Home
This home is located at 1270 Creekside Ct SE Unit 3, Smyrna, GA 30080 and is currently estimated at $238,843, approximately $221 per square foot. 1270 Creekside Ct SE Unit 3 is a home located in Cobb County with nearby schools including Argyle Elementary School, Campbell Middle School, and Campbell High School.
Ownership History
Date
Name
Owned For
Owner Type
Purchase Details
Closed on
Oct 26, 2016
Sold by
Sgi Investments Llc
Bought by
Zaboli Tony S
Current Estimated Value
Purchase Details
Closed on
Jan 27, 2011
Sold by
Secured Group Investors Inc
Bought by
Nafis Properties Llc
Purchase Details
Closed on
Aug 27, 2010
Sold by
Federal Home Loan Mortgage Corporation
Bought by
Secured Grp Investors Inc
Purchase Details
Closed on
Nov 19, 1999
Sold by
Hall Devoria D
Bought by
Hall Tanisha O
Home Financials for this Owner
Home Financials are based on the most recent Mortgage that was taken out on this home.
Original Mortgage
$79,055
Interest Rate
7.68%
Mortgage Type
New Conventional
Purchase Details
Closed on
Aug 5, 1994
Sold by
Whitmore Dawn M
Bought by
Hall Devoria D
Home Financials for this Owner
Home Financials are based on the most recent Mortgage that was taken out on this home.
Original Mortgage
$51,891
Interest Rate
8.65%
Mortgage Type
FHA
Create a Home Valuation Report for This Property
The Home Valuation Report is an in-depth analysis detailing your home's value as well as a comparison with similar homes in the area
Home Values in the Area
Average Home Value in this Area
Purchase History
| Date | Buyer | Sale Price | Title Company |
|---|---|---|---|
| Zaboli Tony S | $40,000 | -- | |
| Nafis Properties Llc | -- | -- | |
| Secured Grp Investors Inc | -- | -- | |
| Hall Tanisha O | $81,500 | -- | |
| Hall Devoria D | $52,900 | -- |
Source: Public Records
Mortgage History
| Date | Status | Borrower | Loan Amount |
|---|---|---|---|
| Previous Owner | Hall Tanisha O | $79,055 | |
| Previous Owner | Hall Devoria D | $51,891 |
Source: Public Records
Tax History Compared to Growth
Tax History
| Year | Tax Paid | Tax Assessment Tax Assessment Total Assessment is a certain percentage of the fair market value that is determined by local assessors to be the total taxable value of land and additions on the property. | Land | Improvement |
|---|---|---|---|---|
| 2025 | $2,495 | $91,868 | $34,000 | $57,868 |
| 2024 | $2,495 | $91,868 | $34,000 | $57,868 |
| 2023 | $2,495 | $91,868 | $34,000 | $57,868 |
| 2022 | $1,666 | $60,876 | $18,000 | $42,876 |
| 2021 | $1,408 | $51,216 | $16,000 | $35,216 |
| 2020 | $1,130 | $41,092 | $12,000 | $29,092 |
| 2019 | $1,130 | $41,092 | $12,000 | $29,092 |
| 2018 | $812 | $29,540 | $6,800 | $22,740 |
| 2017 | $413 | $16,000 | $5,760 | $10,240 |
| 2016 | $486 | $18,840 | $6,800 | $12,040 |
| 2015 | $402 | $15,240 | $3,200 | $12,040 |
| 2014 | $335 | $12,588 | $0 | $0 |
Source: Public Records
Map
Nearby Homes
- 1138 Falling Water Dr SE
- 1247 Falling Water Dr SE
- 5284 Afton Way SE
- 1350 Overlook Cove SE
- 5136 Afton Way SE
- 2736 Bell Dr SE
- 2668 Farmstead Rd SE
- 1305 Ridgecrest Ln SE
- 1279 Ridgecrest Ln SE
- 2731 Carolyn Dr SE
- 2543 Oakbourne Ln
- 2555 Oakbourne Ln
- 1024 Rohner Way
- 2640 Spring Dr SE
- 1572 Wicker Wood Place
- 1572 Wicker Wood SE
- 1576 Wicker Wood Place
- 2617 Camphor Crossing SE Unit 88
- 2605 Camphor Crossing SE Unit 91
- Chestatee Plan at Rowan Walk - Cottages Collection
- 1272 Creekside Ct SE Unit 3
- 1260 Creekside Ct SE
- 1258 Creekside Ct SE
- 1258 Creekside Ct SE Unit 1258
- 1282 Creekside Ct SE
- 1282 Creekside Ct SE
- 1284 Creekside Ct SE
- 1257 Falling Water Dr SE
- 1257 Falling Water Dr SE
- 1259 Falling Water Dr SE Unit 2
- 1163 Falling Water Dr SE
- 1269 Falling Water Dr SE
- 1149 Falling Water Dr SE Unit 3
- 1245 Falling Water Dr SE
- 1161 Falling Water Dr SE Unit 2
- 1151 Falling Water Dr SE
- 1294 Creekside Ct SE
- 1271 Falling Water Dr SE
- 1173 Falling Water Dr SE
- 1175 Falling Water Dr SE Unit 2