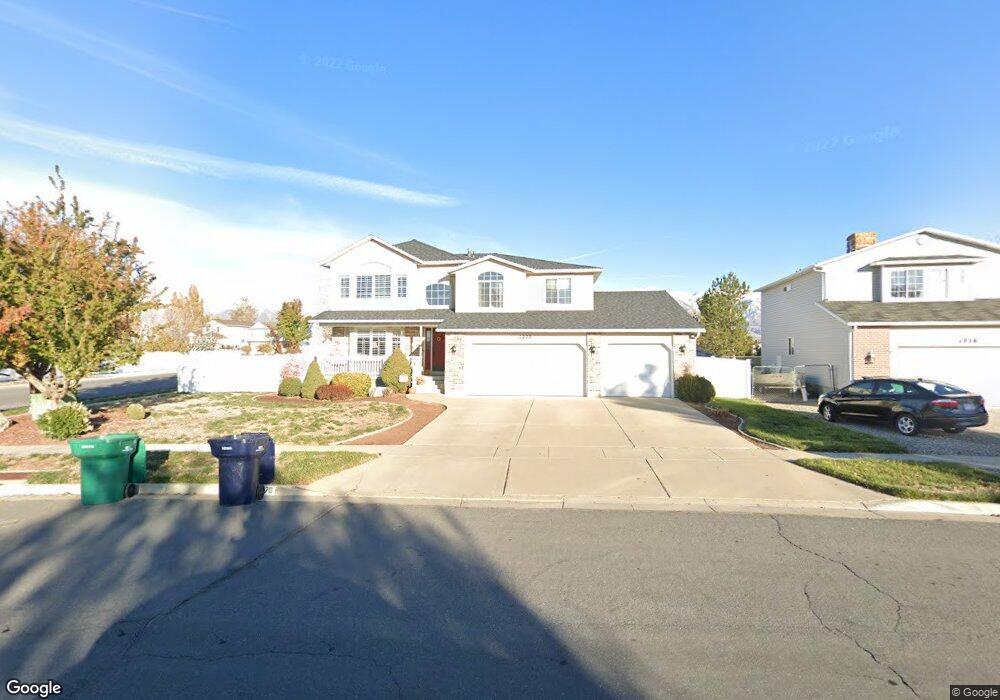
1270 N 2375 W Layton, UT 84041
Estimated Value: $605,825 - $633,000
5
Beds
4
Baths
2,967
Sq Ft
$208/Sq Ft
Est. Value
About This Home
This home is located at 1270 N 2375 W, Layton, UT 84041 and is currently estimated at $616,956, approximately $207 per square foot. 1270 N 2375 W is a home located in Davis County with nearby schools including Ellison Park School, Shoreline Junior High School, and Layton High School.
Ownership History
Date
Name
Owned For
Owner Type
Purchase Details
Closed on
Oct 13, 2017
Sold by
Broome Christine G and Broome Jerry P
Bought by
Seal Tyson K and Seal Jennifer W
Current Estimated Value
Home Financials for this Owner
Home Financials are based on the most recent Mortgage that was taken out on this home.
Original Mortgage
$242,998
Outstanding Balance
$202,263
Interest Rate
3.78%
Mortgage Type
VA
Estimated Equity
$414,693
Purchase Details
Closed on
Oct 5, 2006
Sold by
Evans Darroll S
Bought by
Broome Jerry P and Broome Christine G
Home Financials for this Owner
Home Financials are based on the most recent Mortgage that was taken out on this home.
Original Mortgage
$178,000
Interest Rate
6.87%
Mortgage Type
Purchase Money Mortgage
Purchase Details
Closed on
Sep 8, 1999
Sold by
Woodside Homes Corp
Bought by
Evans Darroll S
Home Financials for this Owner
Home Financials are based on the most recent Mortgage that was taken out on this home.
Original Mortgage
$168,700
Interest Rate
7.89%
Create a Home Valuation Report for This Property
The Home Valuation Report is an in-depth analysis detailing your home's value as well as a comparison with similar homes in the area
Home Values in the Area
Average Home Value in this Area
Purchase History
| Date | Buyer | Sale Price | Title Company |
|---|---|---|---|
| Seal Tyson K | -- | -- | |
| Broome Jerry P | -- | Bonneville Superior Title Co | |
| Evans Darroll S | -- | First American Title Co |
Source: Public Records
Mortgage History
| Date | Status | Borrower | Loan Amount |
|---|---|---|---|
| Open | Seal Tyson K | $242,998 | |
| Previous Owner | Broome Jerry P | $178,000 | |
| Previous Owner | Evans Darroll S | $168,700 |
Source: Public Records
Tax History Compared to Growth
Tax History
| Year | Tax Paid | Tax Assessment Tax Assessment Total Assessment is a certain percentage of the fair market value that is determined by local assessors to be the total taxable value of land and additions on the property. | Land | Improvement |
|---|---|---|---|---|
| 2025 | $2,155 | $330,550 | $108,465 | $222,085 |
| 2024 | $3,022 | $319,550 | $119,331 | $200,219 |
| 2023 | $2,929 | $546,000 | $119,386 | $426,614 |
| 2022 | $3,195 | $323,400 | $73,780 | $249,620 |
| 2021 | $2,822 | $426,000 | $110,688 | $315,312 |
| 2020 | $2,555 | $370,000 | $93,341 | $276,659 |
| 2019 | $2,489 | $353,000 | $95,348 | $257,652 |
| 2018 | $2,311 | $329,000 | $83,674 | $245,326 |
| 2016 | $1,892 | $138,985 | $33,087 | $105,898 |
| 2015 | $1,917 | $133,650 | $33,087 | $100,563 |
| 2014 | $1,868 | $133,194 | $33,087 | $100,107 |
| 2013 | -- | $120,358 | $28,952 | $91,406 |
Source: Public Records
Map
Nearby Homes
- 2438 W 1400 N
- 1477 N 2375 W
- 2543 W 1275 N
- 1430 N 2100 W
- 2114 S 825 E
- 2115 W 1225 N
- 1071 Jamie-Matt Cir
- 1491 N 1875 W
- 1491 N 1875 W Unit 158
- 1487 N 1875 W
- 1487 N 1875 W Unit 159
- 1483 N 1875 W
- 1479 N 1875 W
- 1479 N 1875 W Unit 161
- 1452 N 1875 W Unit 146
- 1463 N 1875 W Unit 165
- 1463 N 1875 W
- 1459 N 1875 W
- 1459 N 1875 W Unit 166
- 1455 N 1875 W Unit 167