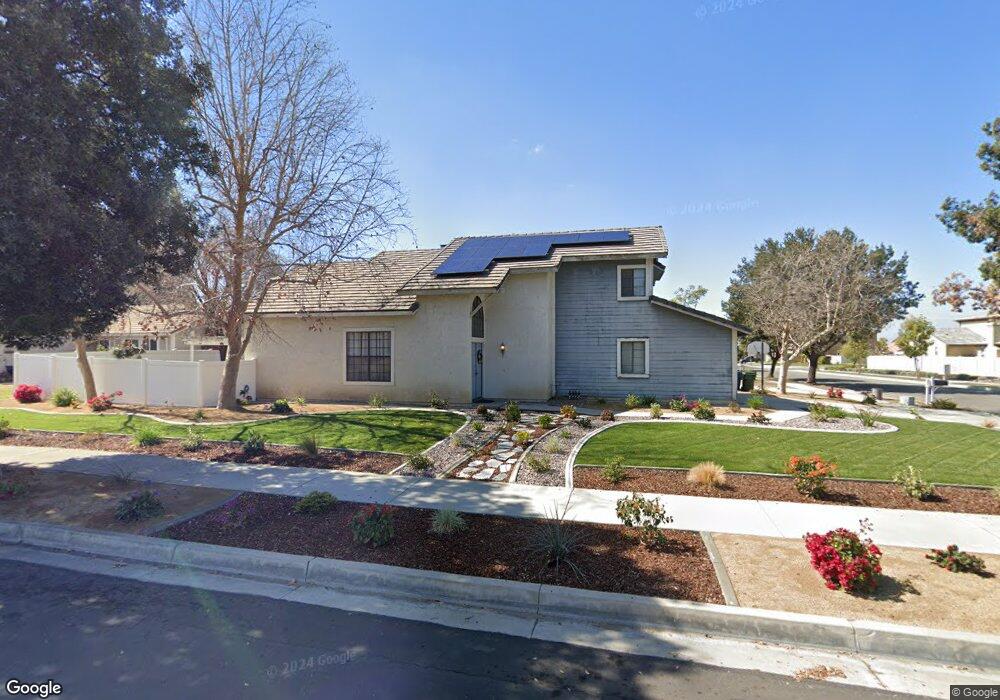
1270 Sherry Way Redlands, CA 92374
North Redlands NeighborhoodEstimated Value: $635,080 - $724,000
4
Beds
3
Baths
1,932
Sq Ft
$348/Sq Ft
Est. Value
About This Home
This home is located at 1270 Sherry Way, Redlands, CA 92374 and is currently estimated at $673,020, approximately $348 per square foot. 1270 Sherry Way is a home located in San Bernardino County with nearby schools including Judson & Brown Elementary School, Clement Middle School, and Redlands East Valley High School.
Ownership History
Date
Name
Owned For
Owner Type
Purchase Details
Closed on
Nov 7, 2006
Sold by
California Cities Home Ownership Corp
Bought by
Best Bryan L and Best Lavees P
Current Estimated Value
Home Financials for this Owner
Home Financials are based on the most recent Mortgage that was taken out on this home.
Original Mortgage
$197,598
Outstanding Balance
$117,864
Interest Rate
6.36%
Mortgage Type
Seller Take Back
Estimated Equity
$555,156
Purchase Details
Closed on
Sep 3, 2002
Sold by
Underwood Vernon R
Bought by
California Cities Home Ownership Corp
Home Financials for this Owner
Home Financials are based on the most recent Mortgage that was taken out on this home.
Original Mortgage
$203,700
Interest Rate
6.22%
Purchase Details
Closed on
Feb 3, 2000
Sold by
Underwood Vernon R and Underwood Patricia K
Bought by
Underwood Vernon R
Create a Home Valuation Report for This Property
The Home Valuation Report is an in-depth analysis detailing your home's value as well as a comparison with similar homes in the area
Home Values in the Area
Average Home Value in this Area
Purchase History
| Date | Buyer | Sale Price | Title Company |
|---|---|---|---|
| Best Bryan L | -- | Ticor Title Company | |
| California Cities Home Ownership Corp | $210,000 | Northern Counties Title | |
| Underwood Vernon R | -- | -- |
Source: Public Records
Mortgage History
| Date | Status | Borrower | Loan Amount |
|---|---|---|---|
| Open | Best Bryan L | $197,598 | |
| Previous Owner | California Cities Home Ownership Corp | $203,700 |
Source: Public Records
Tax History
| Year | Tax Paid | Tax Assessment Tax Assessment Total Assessment is a certain percentage of the fair market value that is determined by local assessors to be the total taxable value of land and additions on the property. | Land | Improvement |
|---|---|---|---|---|
| 2025 | $9,769 | $576,112 | $133,980 | $442,132 |
| 2024 | $9,294 | $564,816 | $131,353 | $433,463 |
| 2023 | $9,286 | $553,741 | $128,777 | $424,964 |
| 2022 | $9,189 | $542,883 | $126,252 | $416,631 |
| 2021 | $8,549 | $471,400 | $141,000 | $330,400 |
| 2020 | $7,889 | $421,400 | $126,900 | $294,500 |
| 2019 | $7,681 | $409,100 | $123,200 | $285,900 |
| 2018 | $5,060 | $409,100 | $123,200 | $285,900 |
| 2017 | $4,944 | $395,200 | $119,000 | $276,200 |
| 2016 | $4,661 | $369,300 | $111,200 | $258,100 |
| 2015 | $4,353 | $342,000 | $103,000 | $239,000 |
| 2014 | $3,779 | $296,000 | $89,000 | $207,000 |
Source: Public Records
Map
Nearby Homes
- 1575 N Grove St
- 1237 Sherry Way
- 1305 E San Bernardino Ave
- 1230 Cantania Dr
- 1251 E Lugonia Ave Unit 27
- 1251 E Lugonia Ave Unit 24
- 1251 E Lugonia Ave Unit 18
- 1678 Harrison Ln
- 1423 Century St
- 1543 Hanford St
- 1412 Medallion St
- 1331 Century St
- 0 E Lugonia Ave
- 1300 E Pioneer Ave
- 1174 Benbow Place
- 1802 Pummelo Dr
- 1323 Kingswood Dr
- 1076 Occidental Cir
- 1653 Lucas Ln
- 1539 Robyn St
- 1266 Sherry Way
- 1525 N Grove St
- 1262 Sherry Way
- 1521 N Grove St
- 1526 N Grove St
- 1534 N Grove St
- 1530 Cheryl St
- 1555 N Grove St
- 1258 Sherry Way
- 1522 N Grove St
- 1536 N Grove St
- 1517 N Grove St
- 1526 Cheryl St
- 1303 Sandra Way
- 1560 Cheryl St
- 1540 N Grove St
- 1522 Cheryl St
- 1513 N Grove St
- 1307 Sandra Way
- 1533 Kelly St
Your Personal Tour Guide
Ask me questions while you tour the home.