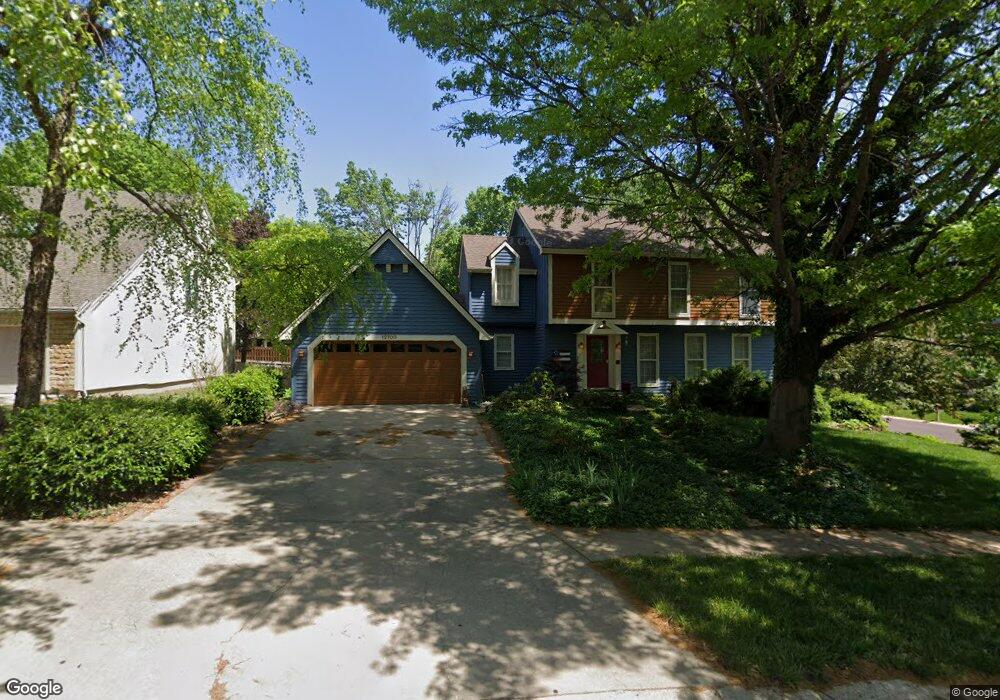
12700 W 116th St Overland Park, KS 66210
Central Overland Park NeighborhoodEstimated Value: $454,000 - $475,000
5
Beds
4
Baths
2,203
Sq Ft
$210/Sq Ft
Est. Value
About This Home
This home is located at 12700 W 116th St, Overland Park, KS 66210 and is currently estimated at $461,843, approximately $209 per square foot. 12700 W 116th St is a home located in Johnson County with nearby schools including Walnut Grove Elementary School, Pioneer Trail Middle School, and Olathe East Sr High School.
Ownership History
Date
Name
Owned For
Owner Type
Purchase Details
Closed on
Sep 16, 2002
Sold by
Smith Clark H and Butler Smith Mary A
Bought by
Smith Clark H and Butler Smith Mary A
Current Estimated Value
Home Financials for this Owner
Home Financials are based on the most recent Mortgage that was taken out on this home.
Original Mortgage
$160,000
Outstanding Balance
$66,691
Interest Rate
6.21%
Estimated Equity
$395,152
Purchase Details
Closed on
Aug 22, 2001
Sold by
Bigus Edward L and Bigus Ellyn K B
Bought by
Smith Clark H and Butler Smith Mary A
Home Financials for this Owner
Home Financials are based on the most recent Mortgage that was taken out on this home.
Original Mortgage
$187,150
Interest Rate
7.16%
Purchase Details
Closed on
Aug 9, 2001
Sold by
Miller Alan B
Bought by
Bigus Edward L and Bigus Ellyn K B
Home Financials for this Owner
Home Financials are based on the most recent Mortgage that was taken out on this home.
Original Mortgage
$187,150
Interest Rate
7.16%
Create a Home Valuation Report for This Property
The Home Valuation Report is an in-depth analysis detailing your home's value as well as a comparison with similar homes in the area
Home Values in the Area
Average Home Value in this Area
Purchase History
| Date | Buyer | Sale Price | Title Company |
|---|---|---|---|
| Smith Clark H | -- | Capital Title Agency Inc | |
| Smith Clark H | -- | Mid America Title Company In | |
| Bigus Edward L | -- | Mid America Title Company In | |
| Bigus Edward L | -- | Mid America Title Company In |
Source: Public Records
Mortgage History
| Date | Status | Borrower | Loan Amount |
|---|---|---|---|
| Open | Smith Clark H | $160,000 | |
| Closed | Smith Clark H | $187,150 | |
| Closed | Smith Clark H | $30,000 |
Source: Public Records
Tax History Compared to Growth
Tax History
| Year | Tax Paid | Tax Assessment Tax Assessment Total Assessment is a certain percentage of the fair market value that is determined by local assessors to be the total taxable value of land and additions on the property. | Land | Improvement |
|---|---|---|---|---|
| 2024 | $5,069 | $46,644 | $10,865 | $35,779 |
| 2023 | $4,968 | $44,873 | $10,865 | $34,008 |
| 2022 | $4,500 | $39,801 | $10,865 | $28,936 |
| 2021 | $4,461 | $37,559 | $8,689 | $28,870 |
| 2020 | $4,182 | $35,190 | $6,683 | $28,507 |
| 2019 | $4,967 | $36,006 | $5,139 | $30,867 |
| 2018 | $4,088 | $33,890 | $5,139 | $28,751 |
| 2017 | $3,809 | $31,326 | $5,139 | $26,187 |
| 2016 | $3,436 | $28,968 | $5,139 | $23,829 |
| 2015 | $3,323 | $28,301 | $5,139 | $23,162 |
| 2013 | -- | $25,265 | $5,139 | $20,126 |
Source: Public Records
Map
Nearby Homes
- 11696 Rosehill Rd
- 12910 W 116th St
- 12701 W 118th St
- 12908 W 118th Terrace
- 11915 Westgate St
- 11918 Westgate St
- 11838 Oakmont St
- 11252 S Summit St
- The Timberland Plan at Riverstone Valley
- The Avalon Plan at Riverstone Valley
- The Rebecca Plan at Riverstone Valley
- The Haley Plan at Riverstone Valley
- The Hudson Plan at Riverstone Valley
- The Hansen Plan at Riverstone Valley
- 17044 Earnshaw St
- 17028 Earnshaw St
- 17100 Earnshaw St
- 17313 Earnshaw St
- 17308 Earnshaw St
- 11328 S Rene St
- 12708 W 116th St
- 11542 Rosehill Rd
- 12684 W 116th St
- 11538 Rosehill Rd
- 12712 W 116th St
- 11543 Rosehill Rd
- 12709 W 116th St
- 12705 W 116th St
- 12715 W 116th St
- 12680 W 116th St
- 12717 W 116th St
- 12701 W 116th St
- 12720 W 116th St
- 11534 Rosehill Rd
- 11539 Rosehill Rd
- 11531 Parkhill St
- 12725 W 116th St
- 12674 W 116th St
- 11678 Rosehill Rd
- 11529 Parkhill St