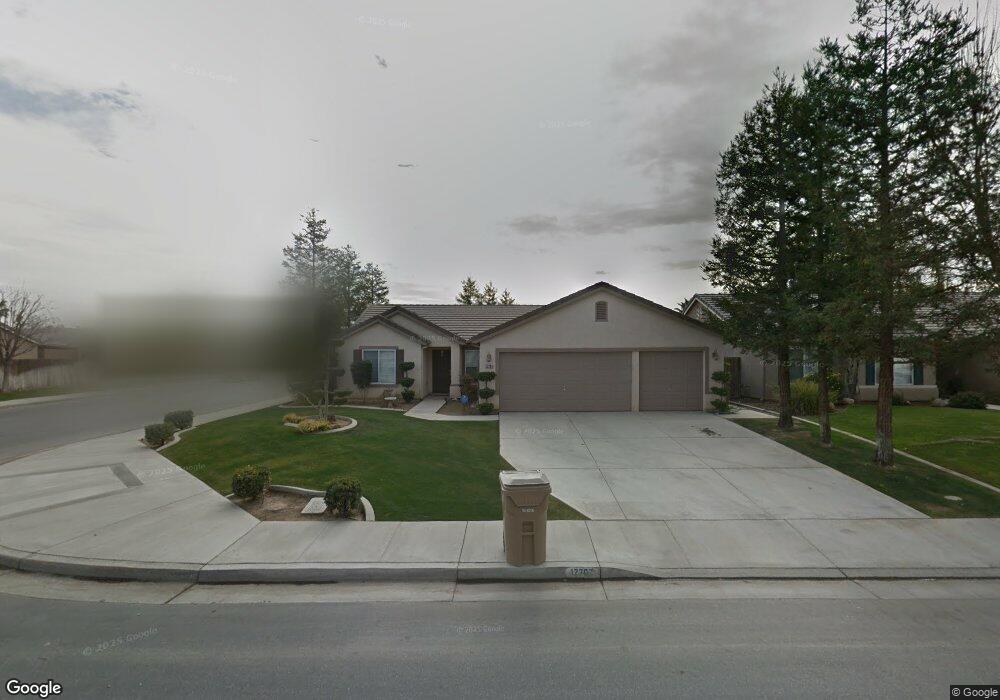
12703 Spoleto Ave Bakersfield, CA 93312
Nottingham Estates NeighborhoodEstimated Value: $397,781 - $431,000
3
Beds
2
Baths
1,522
Sq Ft
$274/Sq Ft
Est. Value
About This Home
This home is located at 12703 Spoleto Ave, Bakersfield, CA 93312 and is currently estimated at $416,945, approximately $273 per square foot. 12703 Spoleto Ave is a home located in Kern County with nearby schools including Veterans Elementary School, Norris Middle School, and Frontier High School.
Ownership History
Date
Name
Owned For
Owner Type
Purchase Details
Closed on
Jul 2, 2021
Sold by
Joyce Creekbaum Lynette
Bought by
Creekbaum Rodney D
Current Estimated Value
Purchase Details
Closed on
May 7, 2015
Sold by
Creekbaum Rodney D and Creekbaum Lynette
Bought by
Creekbaum Family Trust
Purchase Details
Closed on
Nov 22, 2010
Sold by
Rose Jon Paul and Rose Leanne
Bought by
Creekbaum Rodney D and Creekbaum Lynette
Home Financials for this Owner
Home Financials are based on the most recent Mortgage that was taken out on this home.
Original Mortgage
$131,250
Interest Rate
4.17%
Mortgage Type
New Conventional
Purchase Details
Closed on
Feb 23, 2001
Sold by
Centex Homes
Bought by
Rose Jon Paul
Home Financials for this Owner
Home Financials are based on the most recent Mortgage that was taken out on this home.
Original Mortgage
$121,250
Interest Rate
6.89%
Create a Home Valuation Report for This Property
The Home Valuation Report is an in-depth analysis detailing your home's value as well as a comparison with similar homes in the area
Home Values in the Area
Average Home Value in this Area
Purchase History
| Date | Buyer | Sale Price | Title Company |
|---|---|---|---|
| Creekbaum Rodney D | -- | -- | |
| Creekbaum Family Trust | -- | None Available | |
| Creekbaum Rodney D | $175,000 | Chicago Title Company | |
| Rose Jon Paul | $125,000 | Chicago Title Co |
Source: Public Records
Mortgage History
| Date | Status | Borrower | Loan Amount |
|---|---|---|---|
| Previous Owner | Creekbaum Rodney D | $131,250 | |
| Previous Owner | Rose Jon Paul | $121,250 | |
| Closed | Rose Jon Paul | $3,250 |
Source: Public Records
Tax History Compared to Growth
Tax History
| Year | Tax Paid | Tax Assessment Tax Assessment Total Assessment is a certain percentage of the fair market value that is determined by local assessors to be the total taxable value of land and additions on the property. | Land | Improvement |
|---|---|---|---|---|
| 2025 | $4,169 | $224,191 | $44,833 | $179,358 |
| 2024 | $4,086 | $219,796 | $43,954 | $175,842 |
| 2023 | $4,086 | $215,488 | $43,093 | $172,395 |
| 2022 | $4,018 | $211,264 | $42,249 | $169,015 |
| 2021 | $3,924 | $207,122 | $41,421 | $165,701 |
| 2020 | $3,819 | $204,999 | $40,997 | $164,002 |
| 2019 | $3,760 | $204,999 | $40,997 | $164,002 |
| 2018 | $3,668 | $197,041 | $39,406 | $157,635 |
| 2017 | $3,645 | $193,179 | $38,634 | $154,545 |
| 2016 | $3,463 | $189,392 | $37,877 | $151,515 |
| 2015 | $3,404 | $186,549 | $37,309 | $149,240 |
| 2014 | $3,332 | $182,896 | $36,579 | $146,317 |
Source: Public Records
Map
Nearby Homes
- 12804 Marradi Ave
- 12515 Valentano Ave
- 12408 Valentano Ave
- 12305 Quiet Pasture Dr
- 12610 Knights Bridge Place
- 12508 Knights Bridge Place
- 12708 Knights Bridge Place
- 12307 Great Country Dr
- 12317 Lavina Ave
- 12509 Willowdale Dr
- 13012 Almondwood Cir
- 12200 Verdelho Ave
- 12211 Timberpointe Dr
- 12203 Timberpointe Dr
- 6821 Nettleton St
- 13006 Almondwood Cir
- 12809 Trafalgar Square Dr
- 6006 Dartmoor Wood Ave
- 6002 Dartmoor Wood Ave
- Hudson Plan at Palm Crossing
- 12709 Spoleto Ave
- 12715 Spoleto Ave
- 12706 Marradi Ave
- 12625 Spoleto Ave
- 12712 Marradi Ave Unit 1
- 12718 Marradi Ave Unit 1
- 12628 Marradi Ave
- 12721 Spoleto Ave
- 12619 Spoleto Ave Unit 1
- 12704 Spoleto Ave
- 12710 Spoleto Ave Unit 1
- 12724 Marradi Ave
- 12716 Spoleto Ave
- 12622 Marradi Ave Unit 1
- 12626 Spoleto Ave Unit 1
- 12727 Spoleto Ave
- 12613 Spoleto Ave Unit 1
- 12620 Spoleto Ave
- 12730 Marradi Ave
- 12616 Marradi Ave