Estimated Value: $637,296 - $774,000
4
Beds
2
Baths
1,302
Sq Ft
$544/Sq Ft
Est. Value
About This Home
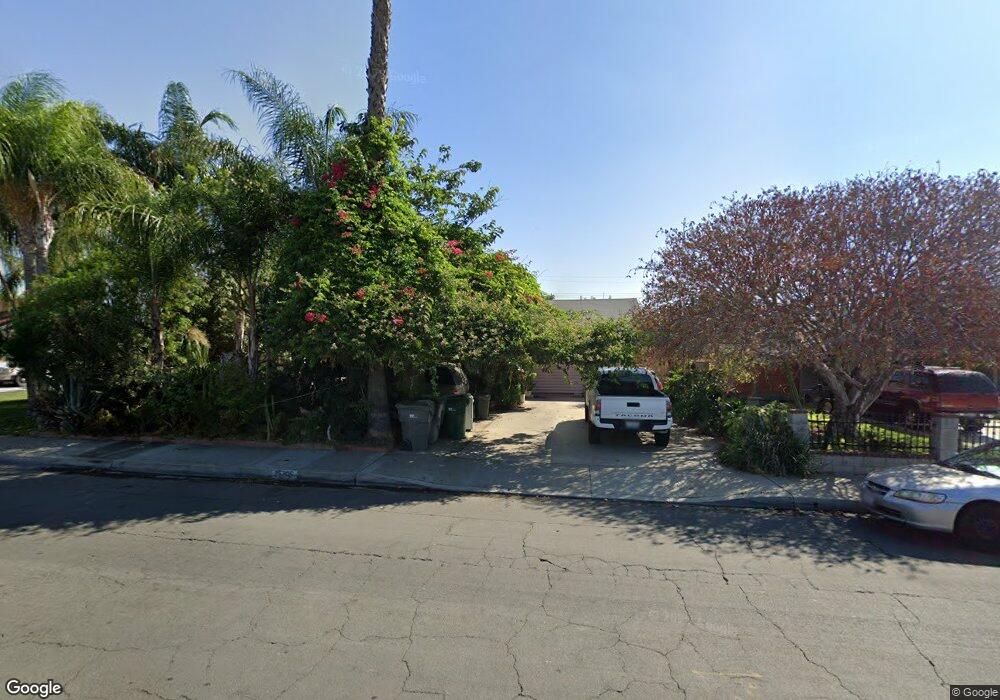
This home is located at 12705 Benson Ave, Chino, CA 91710 and is currently estimated at $708,574, approximately $544 per square foot. 12705 Benson Ave is a home located in San Bernardino County with nearby schools including Walnut Avenue Elementary, Magnolia Junior High, and Chino High School.
Ownership History
Date
Name
Owned For
Owner Type
Purchase Details
Closed on
Dec 27, 2023
Sold by
Munoz Maria
Bought by
Maria Munoz Living Trust and Munoz
Current Estimated Value
Purchase Details
Closed on
Nov 4, 2003
Sold by
Munoz Jorge
Bought by
Munoz Jorge and Munoz Maria
Purchase Details
Closed on
Apr 22, 2002
Sold by
Munoz Maria
Bought by
Munoz Jorge
Home Financials for this Owner
Home Financials are based on the most recent Mortgage that was taken out on this home.
Original Mortgage
$160,000
Interest Rate
7.08%
Purchase Details
Closed on
Oct 5, 1993
Sold by
Hurley Elwood J
Bought by
Munoz Jorge and Munoz Maria
Home Financials for this Owner
Home Financials are based on the most recent Mortgage that was taken out on this home.
Original Mortgage
$123,500
Interest Rate
6.74%
Create a Home Valuation Report for This Property
The Home Valuation Report is an in-depth analysis detailing your home's value as well as a comparison with similar homes in the area
Home Values in the Area
Average Home Value in this Area
Purchase History
| Date | Buyer | Sale Price | Title Company |
|---|---|---|---|
| Maria Munoz Living Trust | -- | None Listed On Document | |
| Munoz Jorge | -- | -- | |
| Munoz Jorge | -- | United Title Company | |
| Munoz Jorge | $130,000 | Orange Coast Title Co |
Source: Public Records
Mortgage History
| Date | Status | Borrower | Loan Amount |
|---|---|---|---|
| Previous Owner | Munoz Jorge | $160,000 | |
| Previous Owner | Munoz Jorge | $123,500 |
Source: Public Records
Tax History
| Year | Tax Paid | Tax Assessment Tax Assessment Total Assessment is a certain percentage of the fair market value that is determined by local assessors to be the total taxable value of land and additions on the property. | Land | Improvement |
|---|---|---|---|---|
| 2025 | $2,481 | $220,959 | $84,985 | $135,974 |
| 2024 | $2,415 | $216,627 | $83,319 | $133,308 |
| 2023 | $2,272 | $212,379 | $81,685 | $130,694 |
| 2022 | $2,258 | $208,214 | $80,083 | $128,131 |
| 2021 | $2,212 | $204,132 | $78,513 | $125,619 |
| 2020 | $2,183 | $202,039 | $77,708 | $124,331 |
| 2019 | $2,144 | $198,077 | $76,184 | $121,893 |
| 2018 | $2,095 | $194,193 | $74,690 | $119,503 |
| 2017 | $2,056 | $190,385 | $73,225 | $117,160 |
| 2016 | $1,921 | $186,652 | $71,789 | $114,863 |
| 2015 | $1,955 | $183,849 | $70,711 | $113,138 |
| 2014 | $1,917 | $180,248 | $69,326 | $110,922 |
Source: Public Records
Map
Nearby Homes
- 12644 Oaks Ave
- 12951 Benson Ave Unit 142
- 12446 Chestnut Place
- 12524 Ross Ave
- 5925 Riverside Dr Unit 12
- 12346 Cedar Ave
- 0 C St
- 13185 14th St
- 12321 Gardenia Place
- 5963 Rosario St
- 5513 D St
- 5195 Walnut Ave Unit 14
- 6221 Garfield St
- 5945 Olvera Ct
- 2321 S Magnolia Ave Unit 12 C
- 12931 4th St
- 5039 Tyler St
- 12737 Carob Ct
- 1961 S Almond Ave
- 1106 W Philadelphia St
- 12695 Benson Ave
- 12715 Benson Ave
- 12687 Benson Ave
- 12706 16th St
- 12714 16th St
- 12696 16th St
- 12723 Benson Ave
- 12688 16th St
- 12724 16th St
- 12677 Benson Ave
- 12678 16th St
- 12732 16th St
- 12669 Benson Ave
- 12741 Benson Ave
- 12742 16th St
- 12670 16th St
- 12659 Benson Ave
- 12705 16th St
- 12660 16th St
- 12695 16th St
Your Personal Tour Guide
Ask me questions while you tour the home.