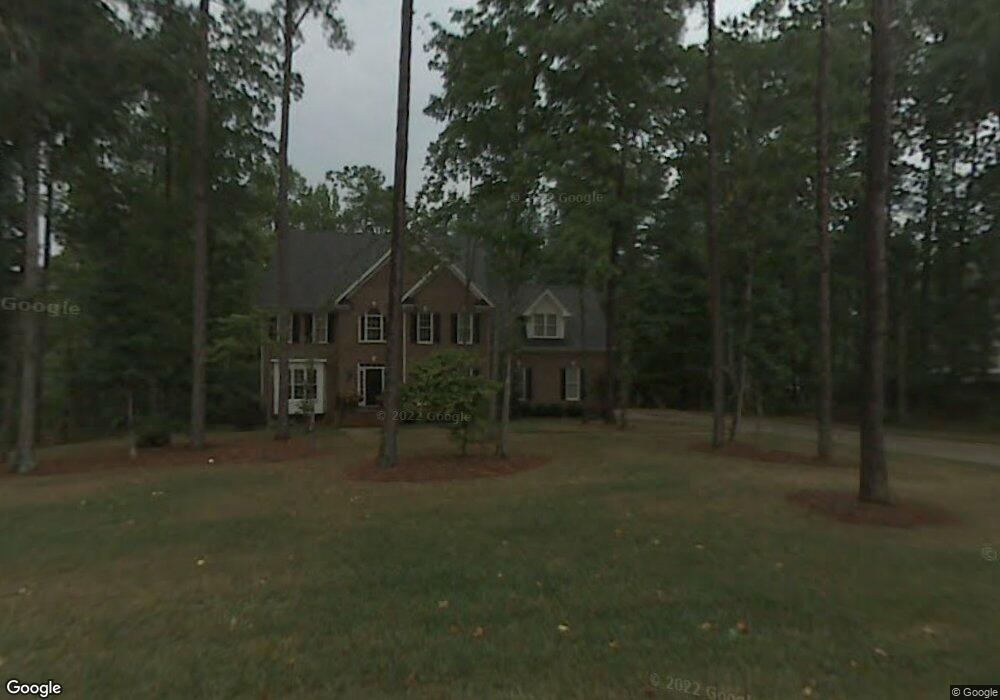
12708 Amoretto Way Raleigh, NC 27613
Estimated Value: $846,000 - $898,000
4
Beds
3
Baths
3,343
Sq Ft
$259/Sq Ft
Est. Value
About This Home
This home is located at 12708 Amoretto Way, Raleigh, NC 27613 and is currently estimated at $866,626, approximately $259 per square foot. 12708 Amoretto Way is a home located in Wake County with nearby schools including Pine Hollow Middle School, Leesville Road High School, and The Franciscan School.
Ownership History
Date
Name
Owned For
Owner Type
Purchase Details
Closed on
Feb 20, 2009
Sold by
Smith William Jordan and Kohlhausen Susan J
Bought by
Miller Steven L and Miller Christa G
Current Estimated Value
Home Financials for this Owner
Home Financials are based on the most recent Mortgage that was taken out on this home.
Original Mortgage
$360,000
Outstanding Balance
$227,198
Interest Rate
5.07%
Mortgage Type
Purchase Money Mortgage
Estimated Equity
$639,428
Purchase Details
Closed on
Oct 31, 2003
Sold by
Bill Clark Homes Of Raleigh Llc
Bought by
Smith William Jordan and Kohlhausen Susan J
Home Financials for this Owner
Home Financials are based on the most recent Mortgage that was taken out on this home.
Original Mortgage
$230,600
Interest Rate
6.03%
Mortgage Type
Purchase Money Mortgage
Create a Home Valuation Report for This Property
The Home Valuation Report is an in-depth analysis detailing your home's value as well as a comparison with similar homes in the area
Home Values in the Area
Average Home Value in this Area
Purchase History
| Date | Buyer | Sale Price | Title Company |
|---|---|---|---|
| Miller Steven L | $450,000 | None Available | |
| Smith William Jordan | $288,500 | -- |
Source: Public Records
Mortgage History
| Date | Status | Borrower | Loan Amount |
|---|---|---|---|
| Open | Miller Steven L | $360,000 | |
| Previous Owner | Smith William Jordan | $230,600 | |
| Closed | Smith William Jordan | $43,200 |
Source: Public Records
Tax History Compared to Growth
Tax History
| Year | Tax Paid | Tax Assessment Tax Assessment Total Assessment is a certain percentage of the fair market value that is determined by local assessors to be the total taxable value of land and additions on the property. | Land | Improvement |
|---|---|---|---|---|
| 2025 | $4,629 | $720,579 | $170,000 | $550,579 |
| 2024 | $4,495 | $720,579 | $170,000 | $550,579 |
| 2023 | $3,864 | $493,041 | $100,000 | $393,041 |
| 2022 | $3,581 | $493,041 | $100,000 | $393,041 |
| 2021 | $3,485 | $493,041 | $100,000 | $393,041 |
| 2020 | $3,427 | $493,041 | $100,000 | $393,041 |
| 2019 | $3,566 | $434,221 | $95,000 | $339,221 |
| 2018 | $3,278 | $434,221 | $95,000 | $339,221 |
| 2017 | $3,107 | $434,221 | $95,000 | $339,221 |
| 2016 | $3,044 | $434,221 | $95,000 | $339,221 |
| 2015 | $3,095 | $442,815 | $104,000 | $338,815 |
| 2014 | $2,934 | $442,815 | $104,000 | $338,815 |
Source: Public Records
Map
Nearby Homes
- 11953 Eagle Cliff Ct
- 11913 Eagle Bluff Cir
- 2729 Sunnystone Way
- 12304 Whartons Way
- 11804 Mountbatten Way
- 5528 Hawthorne Park
- 5240 Indigo Moon Way
- 2409 Loring Ct
- 5020 Red Cedar Rd
- 12316 Amoretto Way
- 11209 Sedgefield Dr
- 8717 Little Deer Ln
- 5308 Roan Mountain Place
- 2612 Scarlet Sage Ct
- 5316 Easthorpe Dr
- 11113 N Radner Way
- 11017 Peacock Moss St
- 12316 Inglehurst Dr
- 12200 Inglehurst Dr
- 5501 Stewartby Dr
- 12712 Amoretto Way
- 5024 Perception Ln
- 5016 Perception Ln
- 12705 Amoretto Way
- 12713 Amoretto Way
- 12716 Amoretto Way
- 12633 Amoretto Way
- 12632 Amoretto Way
- 5023 Perception Ln
- 5008 Perception Ln
- 12717 Amoretto Way
- 12720 Amoretto Way
- 5017 Perception Ln
- 2924 Sunnystone Way
- 12724 Amoretto Way
- 5013 Perception Ln
- 12625 Amoretto Way
- 12628 Amoretto Way
- 5004 Perception Ln
- 2916 Sunnystone Way