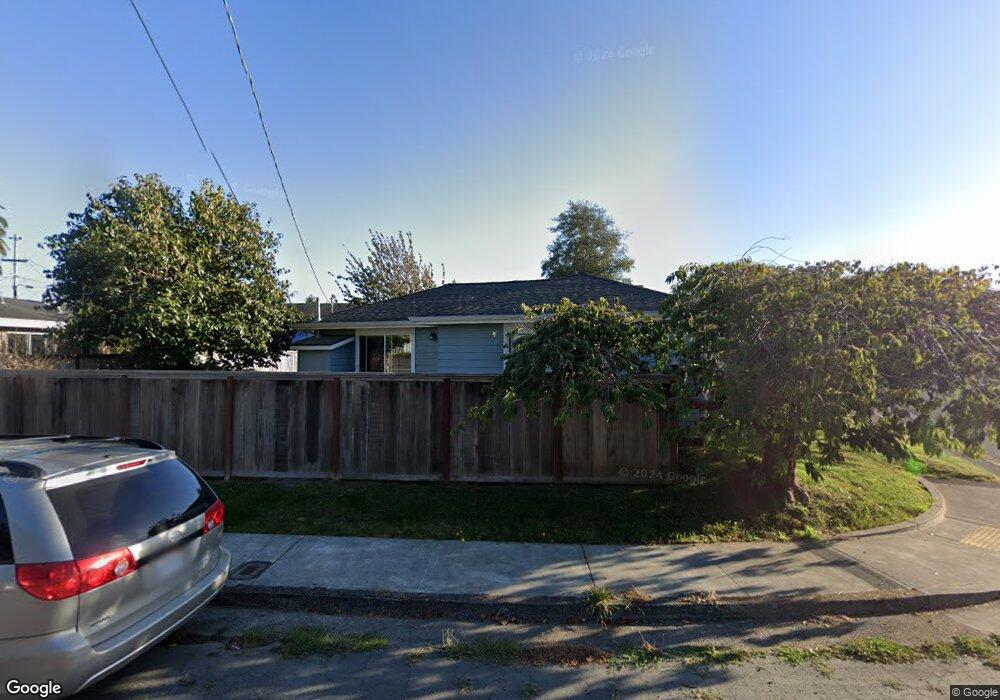
1271 Anina Way Arcata, CA 95521
Westwood-Vasside NeighborhoodEstimated Value: $378,000 - $476,000
2
Beds
1
Bath
800
Sq Ft
$542/Sq Ft
Est. Value
About This Home
This home is located at 1271 Anina Way, Arcata, CA 95521 and is currently estimated at $433,612, approximately $542 per square foot. 1271 Anina Way is a home located in Humboldt County with nearby schools including Arcata Elementary School, Sunny Brae Middle School, and Arcata High School.
Ownership History
Date
Name
Owned For
Owner Type
Purchase Details
Closed on
Dec 13, 2012
Sold by
Garrahan Evan D and Garrahan Ronald P
Bought by
Garrahan Evan D and Garrahan Amy K
Current Estimated Value
Home Financials for this Owner
Home Financials are based on the most recent Mortgage that was taken out on this home.
Original Mortgage
$217,500
Outstanding Balance
$96,128
Interest Rate
3.37%
Mortgage Type
New Conventional
Estimated Equity
$337,484
Purchase Details
Closed on
Nov 21, 2007
Sold by
Devoe John and Holmes Clare
Bought by
Garrahan Evan and Garrahan Ronald P
Home Financials for this Owner
Home Financials are based on the most recent Mortgage that was taken out on this home.
Original Mortgage
$232,000
Interest Rate
6.15%
Mortgage Type
Purchase Money Mortgage
Purchase Details
Closed on
Oct 25, 2005
Sold by
Chezem Elvera
Bought by
Devoe John and Holmes Clare
Home Financials for this Owner
Home Financials are based on the most recent Mortgage that was taken out on this home.
Original Mortgage
$243,750
Interest Rate
5.74%
Mortgage Type
New Conventional
Create a Home Valuation Report for This Property
The Home Valuation Report is an in-depth analysis detailing your home's value as well as a comparison with similar homes in the area
Home Values in the Area
Average Home Value in this Area
Purchase History
| Date | Buyer | Sale Price | Title Company |
|---|---|---|---|
| Garrahan Evan D | -- | First American Title | |
| Garrahan Evan | $290,000 | Humboldt Land Title Company | |
| Devoe John | $325,000 | Humboldt Land Title Co |
Source: Public Records
Mortgage History
| Date | Status | Borrower | Loan Amount |
|---|---|---|---|
| Open | Garrahan Evan D | $217,500 | |
| Closed | Garrahan Evan | $232,000 | |
| Previous Owner | Devoe John | $243,750 |
Source: Public Records
Tax History
| Year | Tax Paid | Tax Assessment Tax Assessment Total Assessment is a certain percentage of the fair market value that is determined by local assessors to be the total taxable value of land and additions on the property. | Land | Improvement |
|---|---|---|---|---|
| 2025 | $4,659 | $410,009 | $210,153 | $199,856 |
| 2024 | $4,659 | $401,971 | $206,033 | $195,938 |
| 2023 | $4,562 | $394,091 | $201,994 | $192,097 |
| 2022 | $4,647 | $386,365 | $198,034 | $188,331 |
| 2021 | $4,425 | $378,790 | $194,151 | $184,639 |
| 2020 | $4,394 | $374,907 | $192,161 | $182,746 |
| 2019 | $4,253 | $367,557 | $188,394 | $179,163 |
| 2018 | $4,154 | $360,350 | $184,700 | $175,650 |
| 2017 | $4,074 | $353,285 | $181,079 | $172,206 |
| 2016 | $3,680 | $321,771 | $177,529 | $144,242 |
| 2015 | $3,640 | $316,939 | $174,863 | $142,076 |
| 2014 | $3,590 | $310,731 | $171,438 | $139,293 |
Source: Public Records
Map
Nearby Homes
- 1666 Stewart Ave
- 2700 Meadow Creek Way
- 1254 Mccallum Cir
- 3028 Alliance Rd
- 3030 Alliance Rd
- 330 California Ave
- 3122 St Louis Rd
- 1836 Blakeslee Ave
- 119 Sylva St
- 812 Diamond Dr
- 113 Sylva St
- 836 12th and 1192 I St
- 1131 Austin Way
- 632 9th St
- 1096 Diamond Dr
- 1346 Diamond Dr
- 3106 Brian Ct
- 2084 Mustang Ln
- 2203 Appaloosa Ln
- 2078 Shetland Ln
Your Personal Tour Guide
Ask me questions while you tour the home.