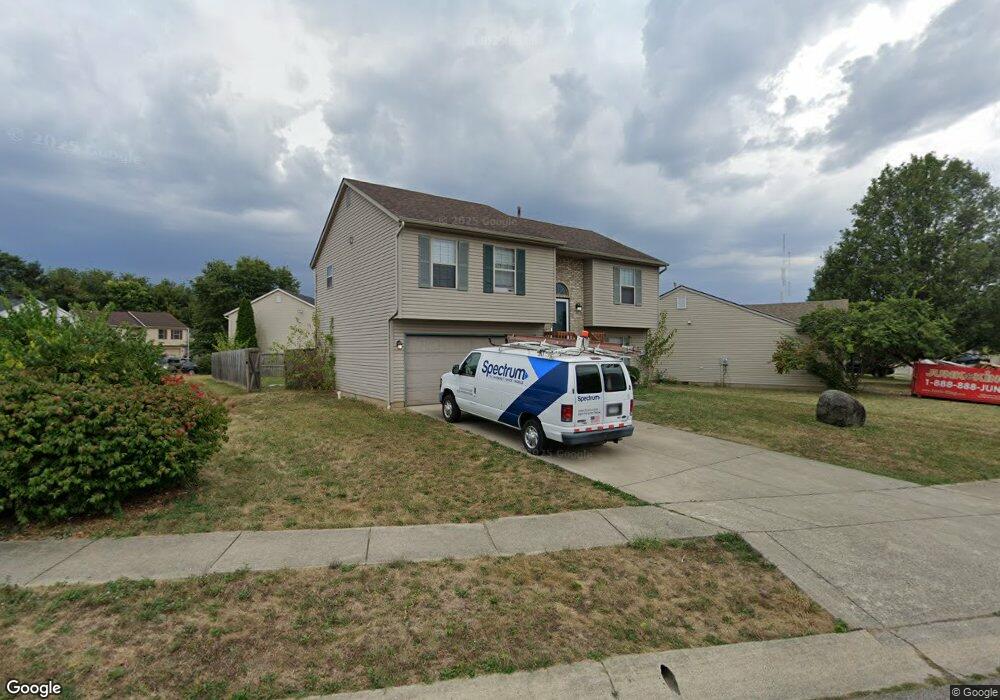
1271 Caravel Dr Columbus, OH 43207
Far South NeighborhoodEstimated Value: $267,000 - $343,000
3
Beds
3
Baths
1,531
Sq Ft
$204/Sq Ft
Est. Value
About This Home
This home is located at 1271 Caravel Dr, Columbus, OH 43207 and is currently estimated at $312,030, approximately $203 per square foot. 1271 Caravel Dr is a home located in Franklin County with nearby schools including Hamilton Elementary School, Hamilton Intermediate School, and Hamilton Middle School.
Ownership History
Date
Name
Owned For
Owner Type
Purchase Details
Closed on
Jun 7, 2017
Sold by
Clark Richard A
Bought by
Gnanaseelan Sangeeta
Current Estimated Value
Home Financials for this Owner
Home Financials are based on the most recent Mortgage that was taken out on this home.
Original Mortgage
$102,750
Interest Rate
4.05%
Mortgage Type
New Conventional
Purchase Details
Closed on
Feb 4, 2004
Sold by
Hud
Bought by
Clark Richard A
Purchase Details
Closed on
Sep 24, 2003
Sold by
Howerton James W and Union Federal Bank Of Indianap
Bought by
Hud
Purchase Details
Closed on
May 28, 1999
Sold by
Crossman Communities Of Ohio Inc
Bought by
Howerton James W and Howerton Shirley L
Home Financials for this Owner
Home Financials are based on the most recent Mortgage that was taken out on this home.
Original Mortgage
$126,278
Interest Rate
6.94%
Mortgage Type
FHA
Create a Home Valuation Report for This Property
The Home Valuation Report is an in-depth analysis detailing your home's value as well as a comparison with similar homes in the area
Home Values in the Area
Average Home Value in this Area
Purchase History
| Date | Buyer | Sale Price | Title Company |
|---|---|---|---|
| Gnanaseelan Sangeeta | $137,000 | None Available | |
| Clark Richard A | $86,000 | Lakeside Title & Escrow Agen | |
| Hud | $76,000 | Preferred Title Agency Inc | |
| Howerton James W | $126,400 | Chicago Title West |
Source: Public Records
Mortgage History
| Date | Status | Borrower | Loan Amount |
|---|---|---|---|
| Open | Gnanaseelan Sangeeta | $102,750 | |
| Previous Owner | Howerton James W | $126,278 |
Source: Public Records
Tax History Compared to Growth
Tax History
| Year | Tax Paid | Tax Assessment Tax Assessment Total Assessment is a certain percentage of the fair market value that is determined by local assessors to be the total taxable value of land and additions on the property. | Land | Improvement |
|---|---|---|---|---|
| 2024 | $3,192 | $80,680 | $23,100 | $57,580 |
| 2023 | $3,141 | $80,675 | $23,100 | $57,575 |
| 2022 | $1,916 | $44,700 | $9,660 | $35,040 |
| 2021 | $1,948 | $44,700 | $9,660 | $35,040 |
| 2020 | $1,993 | $44,700 | $9,660 | $35,040 |
| 2019 | $1,836 | $37,560 | $8,050 | $29,510 |
| 2018 | $913 | $37,560 | $8,050 | $29,510 |
| 2017 | $1,859 | $37,560 | $8,050 | $29,510 |
| 2016 | $1,788 | $33,780 | $8,650 | $25,130 |
| 2015 | $905 | $33,780 | $8,650 | $25,130 |
| 2014 | $1,817 | $33,780 | $8,650 | $25,130 |
| 2013 | $990 | $37,800 | $8,645 | $29,155 |
Source: Public Records
Map
Nearby Homes
- 4410 Holstein Dr
- 1143 Gelbray Dr
- 4282 Sestos Dr
- 1459 Tera Alta Rd
- 1145 Rendezvous Ln
- 1187 Rendezvous Ln
- 4261 Gelbray Ct
- 1510 Halfhill Way
- 4207 Crosspointe Dr
- 4241 Gelbray Ct
- 4434 Butler Farms Dr
- 4451 1/2 Lockbourne Rd Unit R
- 4441 Butler Farms Dr
- 4175 Holstein Dr
- 965 Radbourne Dr
- 4309 Salt Spring Ln
- 1624 Marlboro Ave
- 1632 Marlboro Ave
- 1021 Lavender Ln
- 3940 Hillman Rd W
- 1259 Caravel Dr
- 4431 Catamaran Dr
- 1253 Caravel Dr
- 4412 Catamaran Dr
- 4395 Catamaran Dr
- 1247 Caravel Dr
- 4418 Catamaran Dr
- 4406 Catamaran Dr
- 4455 Catamaran Dr
- 4430 Catamaran Dr
- 1266 Caravel Dr
- 4424 Catamaran Dr
- 1241 Caravel Dr
- 4383 Catamaran Dr
- 1254 Caravel Dr
- 4461 Catamaran Dr
- 1248 Caravel Dr
- 4436 Catamaran Dr
- 4400 Catamaran Dr