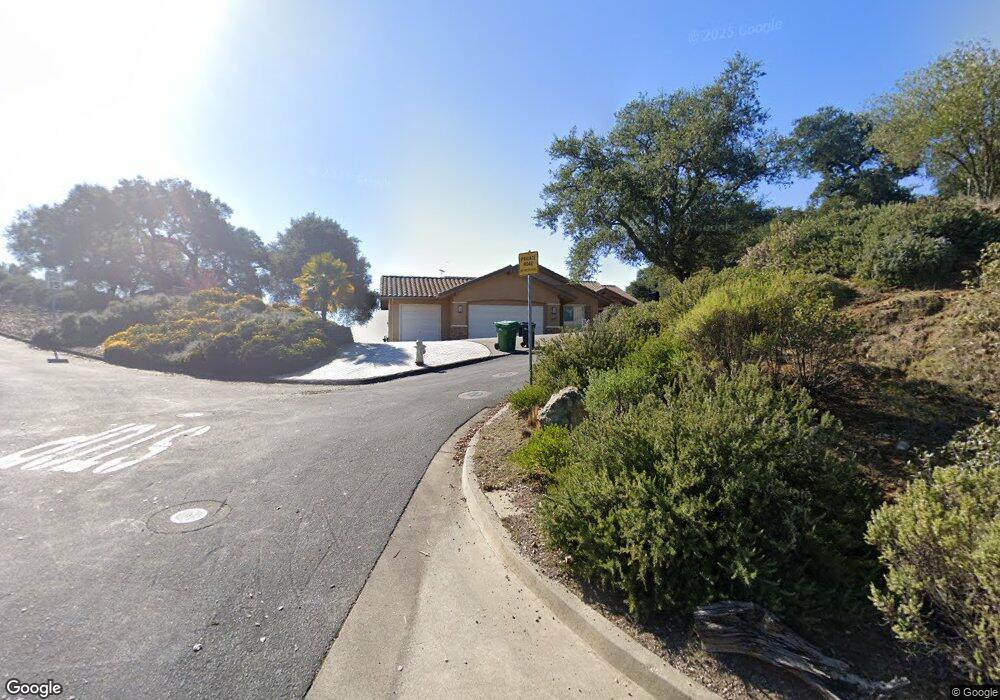
12711 Rojo Ct Unit 7 Atascadero, CA 93422
Estimated Value: $1,353,000 - $2,035,000
4
Beds
3
Baths
3,498
Sq Ft
$450/Sq Ft
Est. Value
About This Home
This home is located at 12711 Rojo Ct Unit 7, Atascadero, CA 93422 and is currently estimated at $1,575,491, approximately $450 per square foot. 12711 Rojo Ct Unit 7 is a home located in San Luis Obispo County with nearby schools including San Gabriel Elementary School, Atascadero Middle School, and Atascadero High School.
Ownership History
Date
Name
Owned For
Owner Type
Purchase Details
Closed on
Nov 11, 2009
Sold by
Wolny Ryszard A
Bought by
Wolny Ryszard A and Wolny Karen S
Current Estimated Value
Purchase Details
Closed on
Oct 3, 2009
Sold by
The Bank Of New York Trust Company Na
Bought by
Wolny Ryszard
Purchase Details
Closed on
May 20, 2009
Sold by
Carpenter Jack
Bought by
The Bank Of New York Trust Company Na
Purchase Details
Closed on
Aug 26, 2005
Sold by
Carpenter Rebecca
Bought by
Carpenter Jack
Home Financials for this Owner
Home Financials are based on the most recent Mortgage that was taken out on this home.
Original Mortgage
$774,550
Interest Rate
6.87%
Mortgage Type
New Conventional
Purchase Details
Closed on
Jul 27, 2005
Sold by
Castlerock Development
Bought by
Carpenter Jack
Home Financials for this Owner
Home Financials are based on the most recent Mortgage that was taken out on this home.
Original Mortgage
$774,550
Interest Rate
6.87%
Mortgage Type
New Conventional
Create a Home Valuation Report for This Property
The Home Valuation Report is an in-depth analysis detailing your home's value as well as a comparison with similar homes in the area
Home Values in the Area
Average Home Value in this Area
Purchase History
| Date | Buyer | Sale Price | Title Company |
|---|---|---|---|
| Wolny Ryszard A | -- | Multiple | |
| Wolny Ryszard | $651,000 | Fidelity National Title Co | |
| The Bank Of New York Trust Company Na | $519,216 | None Available | |
| Carpenter Jack | -- | Fidelity Title Company | |
| Carpenter Jack | $1,106,500 | Fidelity Title Company |
Source: Public Records
Mortgage History
| Date | Status | Borrower | Loan Amount |
|---|---|---|---|
| Previous Owner | Carpenter Jack | $774,550 |
Source: Public Records
Tax History Compared to Growth
Tax History
| Year | Tax Paid | Tax Assessment Tax Assessment Total Assessment is a certain percentage of the fair market value that is determined by local assessors to be the total taxable value of land and additions on the property. | Land | Improvement |
|---|---|---|---|---|
| 2025 | $9,154 | $840,311 | $387,241 | $453,070 |
| 2024 | $9,150 | $823,836 | $379,649 | $444,187 |
| 2023 | $9,150 | $807,683 | $372,205 | $435,478 |
| 2022 | $9,037 | $791,847 | $364,907 | $426,940 |
| 2021 | $8,860 | $776,321 | $357,752 | $418,569 |
| 2020 | $8,560 | $768,362 | $354,084 | $414,278 |
| 2019 | $8,597 | $753,297 | $347,142 | $406,155 |
| 2018 | $8,429 | $738,528 | $340,336 | $398,192 |
| 2017 | $8,263 | $724,048 | $333,663 | $390,385 |
| 2016 | $8,101 | $709,852 | $327,121 | $382,731 |
| 2015 | $7,978 | $699,191 | $322,208 | $376,983 |
| 2014 | $7,287 | $685,496 | $315,897 | $369,599 |
Source: Public Records
Map
Nearby Homes
- 12703 Paso Verde Ct
- 12400 San Marcos Rd
- 0 San Felipe Ct
- 0 San Felipe Rd
- 12460 San Marcos Rd
- 11800 San Marcos Rd
- 11955 Santa Lucia Rd
- 11555 Cenegal Rd
- 9575 Laurel Rd
- 14105 County Kerry Ln
- 13700 Morro Rd
- 13750 Falcon Rd
- 6205 Toro Creek Rd
- 13205 Santa Lucia Rd
- 10885 San Marcos Rd
- 6650 Toro Creek Rd
- 6452 Alta Pradera Ln
- 12750 Santa Ana Rd
- 9400 Corriente Rd
- 14220 El Monte Rd
- 12711 Rojo Ct
- 12716 Rojo Ct Unit 8
- 12716 Rojo Ct
- 12685 Cabazon Rd Unit 98
- 12685 Cabazon Rd
- 12726 Rojo Court #9
- 12709 Paso Verde Ct Unit 6
- 12709 Paso Verde Ct
- 12726 Rojo Ct
- 12675 Cabazon Rd Unit 99
- 12706 Paso Verde Ct Unit 5
- 12706 Paso Verde Ct
- 12680 Cabazon Rd
- 12280 San Marcos Rd
- 12680 Cabazon Road #97
- 12730 Rojo Ct Unit 10
- 12730 Rojo Ct
- 12749 Rojo Ct Unit 12
- 12749 Rojo Ct
- 12300 San Marcos Road #80