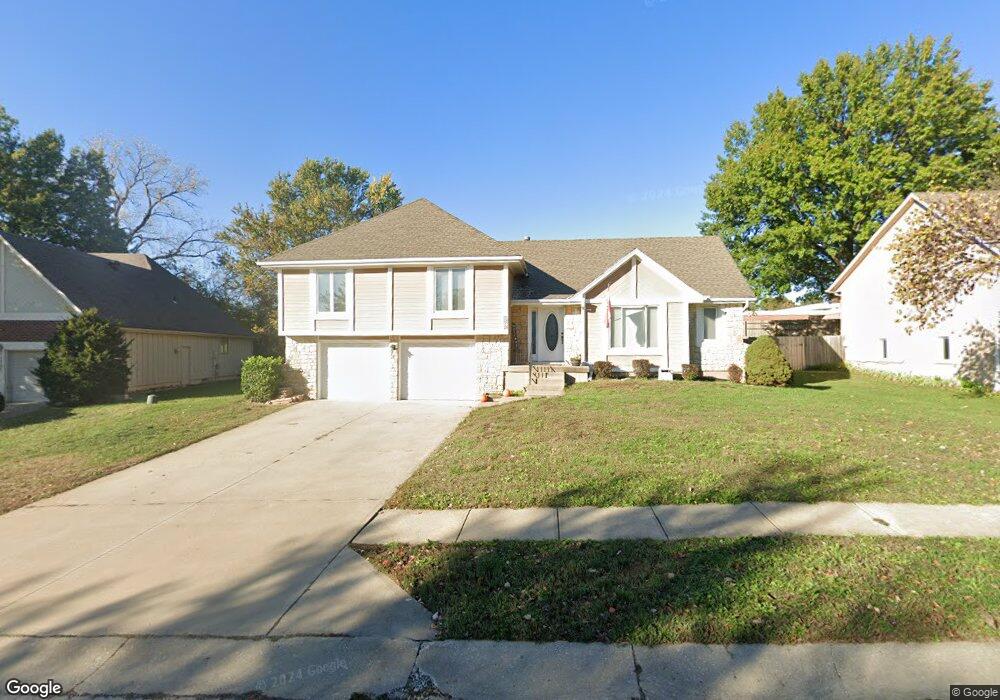
12712 E 62nd Ct Kansas City, MO 64133
Little Blue Valley NeighborhoodEstimated Value: $246,000 - $320,000
3
Beds
2
Baths
1,663
Sq Ft
$170/Sq Ft
Est. Value
About This Home
This home is located at 12712 E 62nd Ct, Kansas City, MO 64133 and is currently estimated at $282,583, approximately $169 per square foot. 12712 E 62nd Ct is a home located in Jackson County with nearby schools including Norfleet Elementary School, Raytown Central Middle School, and Raytown South High School.
Ownership History
Date
Name
Owned For
Owner Type
Purchase Details
Closed on
Jul 1, 2021
Sold by
Verlinden Gerald J and Verlinden Ann T
Bought by
Minter Michael and Vostrez Anna
Current Estimated Value
Home Financials for this Owner
Home Financials are based on the most recent Mortgage that was taken out on this home.
Original Mortgage
$248,425
Outstanding Balance
$225,682
Interest Rate
2.98%
Estimated Equity
$56,901
Purchase Details
Closed on
Apr 15, 2011
Sold by
Secretary Of Housing & Urban Development
Bought by
Warren Nathan L
Purchase Details
Closed on
Aug 18, 2010
Sold by
Wells Fargo Bank Na
Bought by
Secretary Of Housing & Urban Development
Purchase Details
Closed on
Jul 21, 2010
Sold by
Kieff Steven P and Kieff Rhonda S
Bought by
Wells Fargo Home Mortgage and Wells Fargo Bank Na
Create a Home Valuation Report for This Property
The Home Valuation Report is an in-depth analysis detailing your home's value as well as a comparison with similar homes in the area
Home Values in the Area
Average Home Value in this Area
Purchase History
| Date | Buyer | Sale Price | Title Company |
|---|---|---|---|
| Minter Michael | -- | None Available | |
| Warren Nathan L | -- | Northwest Title Agency | |
| Secretary Of Housing & Urban Development | -- | None Available | |
| Wells Fargo Home Mortgage | -- | None Available |
Source: Public Records
Mortgage History
| Date | Status | Borrower | Loan Amount |
|---|---|---|---|
| Open | Minter Michael | $248,425 |
Source: Public Records
Tax History Compared to Growth
Tax History
| Year | Tax Paid | Tax Assessment Tax Assessment Total Assessment is a certain percentage of the fair market value that is determined by local assessors to be the total taxable value of land and additions on the property. | Land | Improvement |
|---|---|---|---|---|
| 2025 | $3,193 | $40,565 | $5,373 | $35,192 |
| 2024 | $3,172 | $35,275 | $4,497 | $30,778 |
| 2023 | $3,172 | $35,275 | $5,787 | $29,488 |
| 2022 | $3,235 | $34,580 | $3,678 | $30,902 |
| 2021 | $3,235 | $34,580 | $3,678 | $30,902 |
| 2020 | $2,976 | $31,436 | $3,678 | $27,758 |
| 2019 | $2,920 | $31,436 | $3,678 | $27,758 |
| 2018 | $2,530 | $27,360 | $3,201 | $24,159 |
| 2017 | $2,450 | $27,360 | $3,201 | $24,159 |
| 2016 | $2,450 | $26,674 | $5,675 | $20,999 |
| 2014 | $2,387 | $25,897 | $5,510 | $20,387 |
Source: Public Records
Map
Nearby Homes
- 12724 E 63rd St
- 6022 Norfleet Rd
- 6009 Marion Ave
- 12101 E 65th Ct
- 5923 Larson Ave
- 6012 Woodside Ave
- 12505 E 58th Terrace
- 12417 E 58th Terrace
- 12915 E 58th St
- 11914 E 59th Terrace
- 11918 E 59th St
- 11715 E 60th St
- 11701 E 61st St
- 11707 E 60th Terrace
- 11600 E 62nd St
- 11601 E 62nd St
- 6322 Norwood Ct
- 12108 E 57th Terrace
- 12005 E 57th Terrace
- 6510 S Noland Rd
- 12716 E 62nd Ct
- 12708 E 62nd Ct
- 12720 E 62nd Ct
- 12704 E 62nd Ct
- 12709 E 62nd Ct
- 12713 E 62nd Ct
- 12717 E 62nd Ct
- 12724 E 62nd Ct
- 12701 E 62nd Ct
- 12705 E 62nd Ct
- 12721 E 62nd Ct
- 12728 E 62nd Ct
- 12708 E 63rd St
- 12704 E 63rd St
- 12725 E 62 Ct
- 12716 E 63rd St
- 12725 E 62nd Ct
- 12720 E 63rd St
- 12700 E 63rd St
- 6300 Vernon Ct