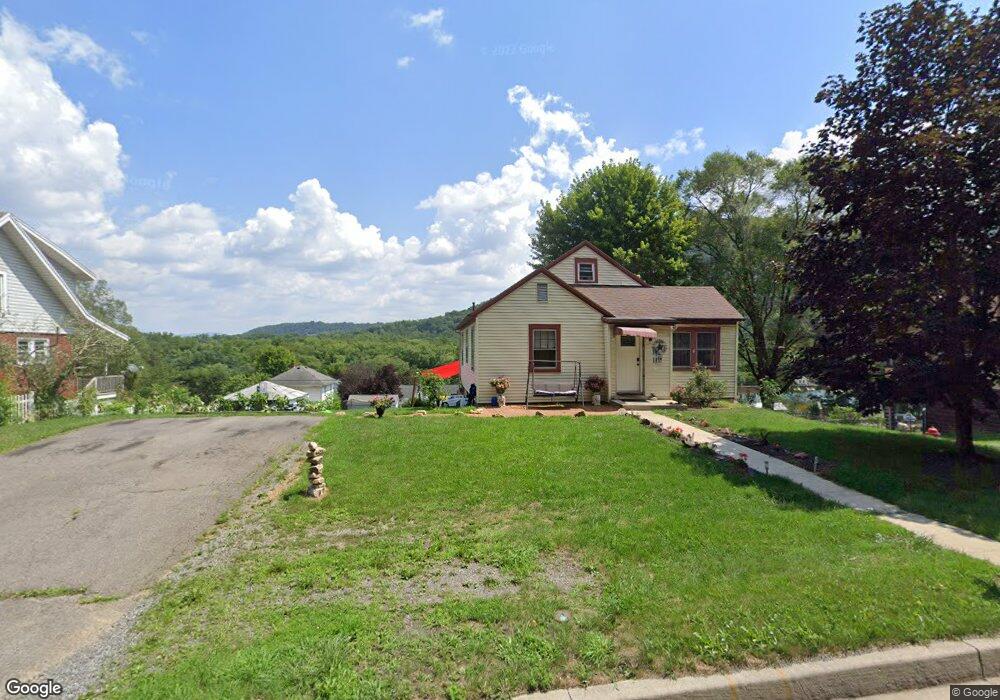
12712 Mcmullen Hwy SW Cumberland, MD 21502
Estimated Value: $112,000 - $160,095
--
Bed
2
Baths
1,402
Sq Ft
$104/Sq Ft
Est. Value
About This Home
This home is located at 12712 Mcmullen Hwy SW, Cumberland, MD 21502 and is currently estimated at $146,274, approximately $104 per square foot. 12712 Mcmullen Hwy SW is a home located in Allegany County with nearby schools including Cresaptown Elementary School, Braddock Middle School, and Allegany High School.
Ownership History
Date
Name
Owned For
Owner Type
Purchase Details
Closed on
Jul 14, 2005
Sold by
Krogel Robert C
Bought by
Grogg Cheryl L
Current Estimated Value
Home Financials for this Owner
Home Financials are based on the most recent Mortgage that was taken out on this home.
Original Mortgage
$72,500
Outstanding Balance
$37,870
Interest Rate
5.67%
Mortgage Type
New Conventional
Estimated Equity
$108,404
Purchase Details
Closed on
Jul 12, 2005
Sold by
Krogel Robert C
Bought by
Grogg Cheryl L
Home Financials for this Owner
Home Financials are based on the most recent Mortgage that was taken out on this home.
Original Mortgage
$72,500
Outstanding Balance
$37,870
Interest Rate
5.67%
Mortgage Type
New Conventional
Estimated Equity
$108,404
Purchase Details
Closed on
Dec 1, 2004
Sold by
Krogel Robert C and Krogel Karen A
Bought by
Krogel Robert C
Purchase Details
Closed on
Aug 26, 1998
Sold by
Couter Greta Mae
Bought by
Krogel Robert C and Krogel Karen A
Create a Home Valuation Report for This Property
The Home Valuation Report is an in-depth analysis detailing your home's value as well as a comparison with similar homes in the area
Home Values in the Area
Average Home Value in this Area
Purchase History
| Date | Buyer | Sale Price | Title Company |
|---|---|---|---|
| Grogg Cheryl L | $72,500 | -- | |
| Grogg Cheryl L | $72,500 | -- | |
| Krogel Robert C | -- | -- | |
| Krogel Robert C | $48,000 | -- |
Source: Public Records
Mortgage History
| Date | Status | Borrower | Loan Amount |
|---|---|---|---|
| Open | Grogg Cheryl L | $72,500 | |
| Closed | Grogg Cheryl L | $72,500 |
Source: Public Records
Tax History Compared to Growth
Tax History
| Year | Tax Paid | Tax Assessment Tax Assessment Total Assessment is a certain percentage of the fair market value that is determined by local assessors to be the total taxable value of land and additions on the property. | Land | Improvement |
|---|---|---|---|---|
| 2025 | $1,199 | $95,700 | $0 | $0 |
| 2024 | $1,281 | $89,800 | $0 | $0 |
| 2023 | $912 | $83,900 | $10,000 | $73,900 |
| 2022 | $1,197 | $81,433 | $0 | $0 |
| 2021 | $1,150 | $78,967 | $0 | $0 |
| 2020 | $1,125 | $76,500 | $10,000 | $66,500 |
| 2019 | $1,091 | $74,733 | $0 | $0 |
| 2018 | $1,065 | $72,967 | $0 | $0 |
| 2017 | $1,040 | $71,200 | $0 | $0 |
| 2016 | $524 | $71,200 | $0 | $0 |
| 2015 | $1,148 | $71,200 | $0 | $0 |
| 2014 | $1,148 | $77,900 | $0 | $0 |
Source: Public Records
Map
Nearby Homes
- 12618 Mahogany St
- 12601 Bowling St
- 12617 N Cresap St
- 12303 Mcmullen Hwy SW
- 11806 Bayberry Ave
- 11902 Mcmullen Hwy SW
- 11903 Mcmullen Hwy SW
- 13515 Primrose St
- 12204 Fall Ave
- 111 S Georgia St
- 1074 Braddock Rd
- 0 Sunset Extended
- 0 0 Sunset Drive Extended #2
- 128 W Clearview Ave
- 1016 Brown Ave
- 0 Sunset View Extended
- 14 Clubhouse Rd
- LOT 2 Cherrywood Ave
- 1107 Cherrywood Ave
- 438 Carr Dr
- 12710 Mcmullen Hwy SW
- 12716 Mcmullen Hwy SW
- 12708 Mcmullen Hwy SW
- 12707 Bowling St
- 12718 Mcmullen Hwy SW
- 12703 Bowling St
- 12706 Mcmullen Hwy SW
- 12709 Bowling St
- 12617 Bowling St
- 12707 Mcmullen Hwy SW
- 12720 Mcmullen Hwy SW
- 12704 Mcmullen Hwy SW
- 12711 Bowling St
- 12719 Mcmullen Hwy SW
- 12615 Bowling St
- 12700 Mcmullen Hwy SW
- 11616 Elm Ave
- 12702 Bowling St
- 12700 Bowling St
- 12706 Bowling St