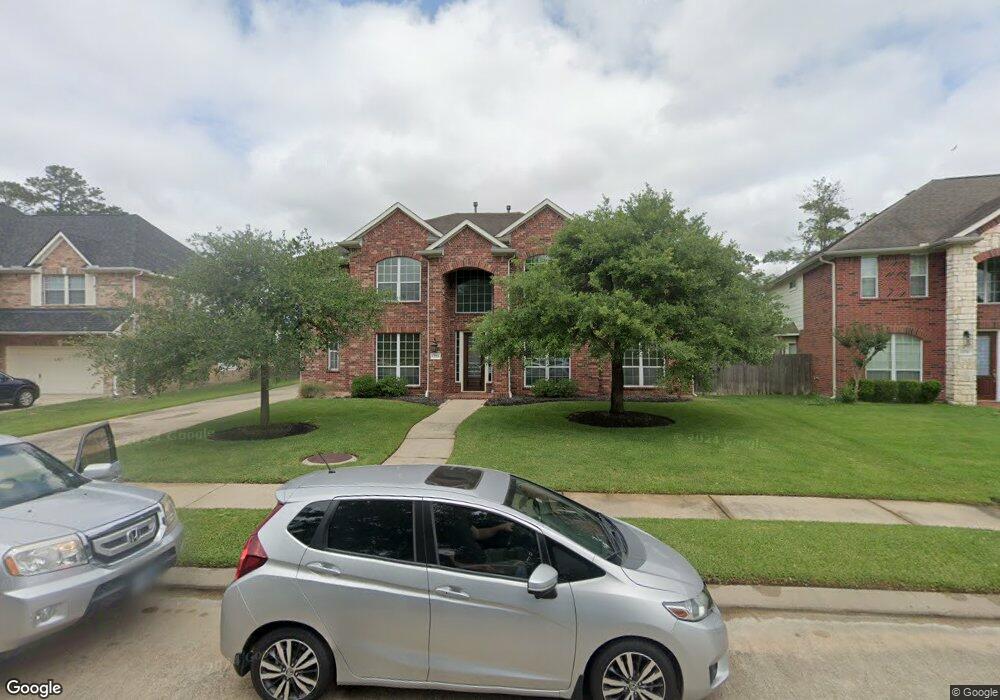
12714 Stanbury Park Ln Tomball, TX 77377
Northpointe NeighborhoodEstimated Value: $497,000 - $529,000
5
Beds
4
Baths
3,556
Sq Ft
$145/Sq Ft
Est. Value
About This Home
This home is located at 12714 Stanbury Park Ln, Tomball, TX 77377 and is currently estimated at $514,025, approximately $144 per square foot. 12714 Stanbury Park Ln is a home located in Harris County with nearby schools including Canyon Pointe Elementary School, Oakcrest Intermediate School, and Tomball Memorial High School.
Ownership History
Date
Name
Owned For
Owner Type
Purchase Details
Closed on
May 31, 2006
Sold by
Jensen James A and Jensen Teresa L
Bought by
Sewell Kelly J and Sewell Melissa S
Current Estimated Value
Home Financials for this Owner
Home Financials are based on the most recent Mortgage that was taken out on this home.
Original Mortgage
$205,150
Outstanding Balance
$126,770
Interest Rate
7.5%
Mortgage Type
Purchase Money Mortgage
Estimated Equity
$387,255
Purchase Details
Closed on
Dec 19, 2003
Sold by
Mth Homes Texas Lp
Bought by
Jensen James A and Jensen Teresa L
Home Financials for this Owner
Home Financials are based on the most recent Mortgage that was taken out on this home.
Original Mortgage
$186,762
Interest Rate
6.02%
Mortgage Type
Purchase Money Mortgage
Create a Home Valuation Report for This Property
The Home Valuation Report is an in-depth analysis detailing your home's value as well as a comparison with similar homes in the area
Home Values in the Area
Average Home Value in this Area
Purchase History
| Date | Buyer | Sale Price | Title Company |
|---|---|---|---|
| Sewell Kelly J | -- | Chicago Title | |
| Jensen James A | -- | Mth Title Company |
Source: Public Records
Mortgage History
| Date | Status | Borrower | Loan Amount |
|---|---|---|---|
| Open | Sewell Kelly J | $205,150 | |
| Previous Owner | Jensen James A | $186,762 | |
| Closed | Jensen James A | $35,017 |
Source: Public Records
Tax History Compared to Growth
Tax History
| Year | Tax Paid | Tax Assessment Tax Assessment Total Assessment is a certain percentage of the fair market value that is determined by local assessors to be the total taxable value of land and additions on the property. | Land | Improvement |
|---|---|---|---|---|
| 2025 | $9,565 | $499,419 | $83,783 | $415,636 |
| 2024 | $9,565 | $507,526 | $82,431 | $425,095 |
| 2023 | $9,565 | $514,000 | $82,431 | $431,569 |
| 2022 | $3,533 | $455,139 | $72,071 | $383,068 |
| 2021 | $9,760 | $335,934 | $58,558 | $277,376 |
| 2020 | $9,360 | $319,611 | $58,558 | $261,053 |
| 2019 | $8,822 | $292,731 | $51,801 | $240,930 |
| 2018 | $3,554 | $290,227 | $51,801 | $238,426 |
| 2017 | $8,860 | $290,227 | $51,801 | $238,426 |
| 2016 | $8,860 | $290,227 | $51,801 | $238,426 |
| 2015 | $7,709 | $290,227 | $51,801 | $238,426 |
| 2014 | $7,709 | $253,985 | $39,639 | $214,346 |
Source: Public Records
Map
Nearby Homes
- 19026 Rustling Ridge Ln
- 12610 Baldwin Springs Ct
- 19006 Rustling Ridge Ln
- 12719 Rocky Briar Ln
- 18903 Danbridge Ct
- 12623 Ember Village Ln
- 12427 Point Arbor Ct
- 18803 Dusty Rose Ln
- 14111 Boudreaux Rd
- 18814 Emery Meadows Ln
- 12414 Montebello Manor Ln
- 18914 Hamish Rd
- 18703 Summercliff Ln
- 18522 Cascade Timbers Ln
- 18603 Bridle Grove Ct
- 12918 Chatfield Manor Ln
- 19114 Canyon Vista Ct
- 18931 Winding Atwood Ln
- 18402 Sierra Falls Ct
- 19023 Wild Thornberry Dr
- 12718 Stanbury Park Ln
- 12710 Stanbury Park Ln
- 12807 Madera Canyon Ln
- 12722 Stanbury Park Ln
- 12706 Stanbury Park Ln
- 12803 Madera Canyon Ln
- 12715 Stanbury Park Ln
- 12811 Madera Canyon Ln
- 12815 Madera Canyon Ln
- 12707 Timber Dove Ln
- 12719 Stanbury Park Ln
- 12707 Stanbury Park Ln
- 12802 Stanbury Park Ln
- 12702 Stanbury Park Ln
- 12723 Stanbury Park Ln
- 12819 Madera Canyon Ln
- 12703 Timber Dove Ln
- 19102 Camden Woods Ct
- 12803 Stanbury Park Ln
- 12806 Stanbury Park Ln