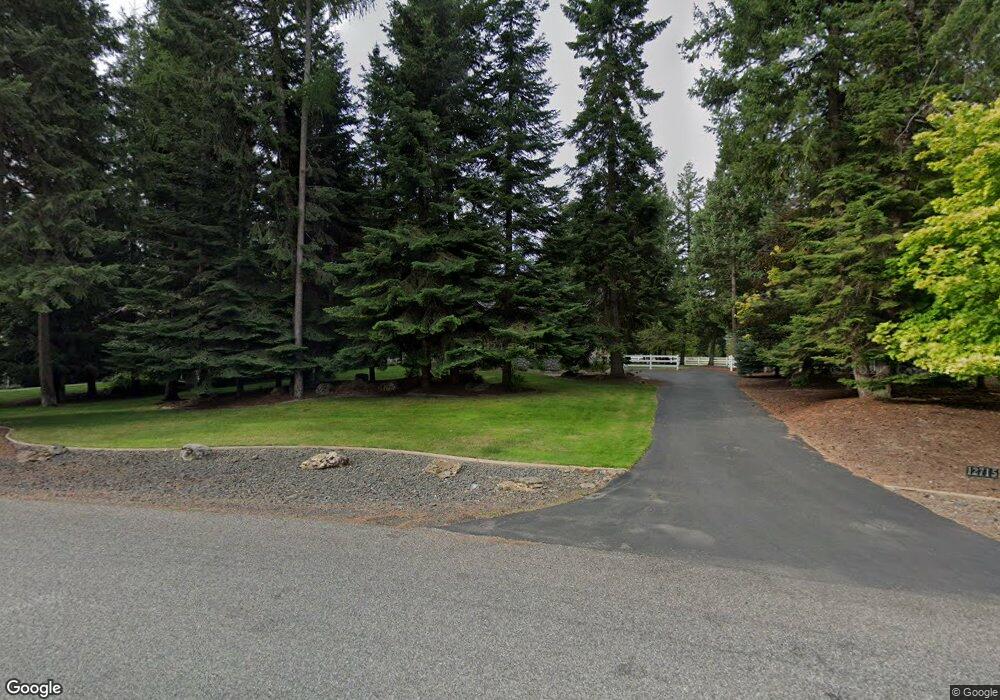
12715 N Yearling Cir Hayden, ID 83835
Estimated Value: $969,817 - $1,338,000
4
Beds
3
Baths
2,501
Sq Ft
$438/Sq Ft
Est. Value
About This Home
This home is located at 12715 N Yearling Cir, Hayden, ID 83835 and is currently estimated at $1,095,704, approximately $438 per square foot. 12715 N Yearling Cir is a home with nearby schools including Hayden Meadows Elementary School, Canfield Middle School, and Coeur d'Alene High School.
Ownership History
Date
Name
Owned For
Owner Type
Purchase Details
Closed on
Aug 28, 2019
Sold by
Anderson Clarence D and Anderson Donna M
Bought by
Anderson Clarence David and Anderson Donna Marie
Current Estimated Value
Purchase Details
Closed on
Jun 27, 2019
Sold by
Forsberg Vera M and Glen And Vera Forsberg Living
Bought by
Anderson Clarence D and Anderson Donna M
Home Financials for this Owner
Home Financials are based on the most recent Mortgage that was taken out on this home.
Original Mortgage
$320,000
Outstanding Balance
$280,788
Interest Rate
4%
Mortgage Type
New Conventional
Estimated Equity
$814,916
Purchase Details
Closed on
May 2, 2013
Sold by
Forsberg Glen R and Forsberg Vera M
Bought by
Forsberg Glen R and Forsberg Vera M
Purchase Details
Closed on
Apr 19, 2010
Sold by
Roller Michael E and Roller Carrie L
Bought by
Forsberg Glen R and Forsberg Vera M
Create a Home Valuation Report for This Property
The Home Valuation Report is an in-depth analysis detailing your home's value as well as a comparison with similar homes in the area
Home Values in the Area
Average Home Value in this Area
Purchase History
| Date | Buyer | Sale Price | Title Company |
|---|---|---|---|
| Anderson Clarence David | -- | None Available | |
| Anderson Clarence D | -- | First American Ttl Kootenai | |
| Forsberg Glen R | -- | None Available | |
| Forsberg Glen R | -- | -- |
Source: Public Records
Mortgage History
| Date | Status | Borrower | Loan Amount |
|---|---|---|---|
| Open | Anderson Clarence D | $320,000 |
Source: Public Records
Tax History Compared to Growth
Tax History
| Year | Tax Paid | Tax Assessment Tax Assessment Total Assessment is a certain percentage of the fair market value that is determined by local assessors to be the total taxable value of land and additions on the property. | Land | Improvement |
|---|---|---|---|---|
| 2025 | $2,845 | $901,093 | $366,927 | $534,166 |
| 2024 | $2,701 | $879,529 | $351,629 | $527,900 |
| 2023 | $2,701 | $954,611 | $401,809 | $552,802 |
| 2022 | $3,299 | $974,531 | $401,809 | $572,722 |
| 2021 | $3,169 | $622,914 | $251,034 | $371,880 |
| 2020 | $3,357 | $563,432 | $230,862 | $332,570 |
| 2019 | $3,352 | $524,952 | $210,762 | $314,190 |
| 2018 | $3,399 | $486,515 | $197,595 | $288,920 |
| 2017 | $3,225 | $441,342 | $164,662 | $276,680 |
| 2016 | $2,943 | $392,389 | $131,749 | $260,640 |
| 2015 | $2,790 | $363,910 | $105,000 | $258,910 |
| 2013 | $2,543 | $315,601 | $80,941 | $234,660 |
Source: Public Records
Map
Nearby Homes
- 12155 N Yearling Cir
- 12665 N Shamrock St
- 1215 E Sleeping Deer Ave
- 11907 N Blue Jay Ct
- 11679 N Avondale Loop
- 1414 E Westdale Dr
- 1361 E Westdale Dr
- 11494 N Avondale Loop
- 1560 E Bruin Loop
- 1538 E Bruin Loop
- LOT 3 Strahorn Rd
- 11354 N Avondale Loop
- 1243 E Sleeping Deer Ave
- 1997 E Avondale Ln
- 1003 E Steeple Chase Rd
- 995 E Steeple Chase Rd
- 975 E Steeple Chase Rd
- 952 E Steeple Chase Rd
- 987 E Steeple Chase Rd
- 969 E Steeple Chase Rd
- 12683 N Yearling Cir
- 12735 N Yearling Cir
- 12740 N Yearling Cir
- 12808 N Yearling Cir
- 2477 E Saint James Ave
- 2425 James St
- 12776 N Yearling Cir
- 12581 N Yearling Cir
- 12785 N Yearling Cir
- 2461 E St James Ave
- 12825 N Yearling Cir
- 12582 N Yearling Cir
- 2587 E Saint James Ave
- 2637 N Yearling Cir
- 0 N Yearling Cir
- 12958 N Yearling Cir
- 2447 E St James Ave
- 12565 N Yearling Cir
- 2495 E St James Ave
- 12909 N Yearling Cir