Estimated Value: $355,000 - $403,000
1
Bed
3
Baths
1,744
Sq Ft
$215/Sq Ft
Est. Value
About This Home
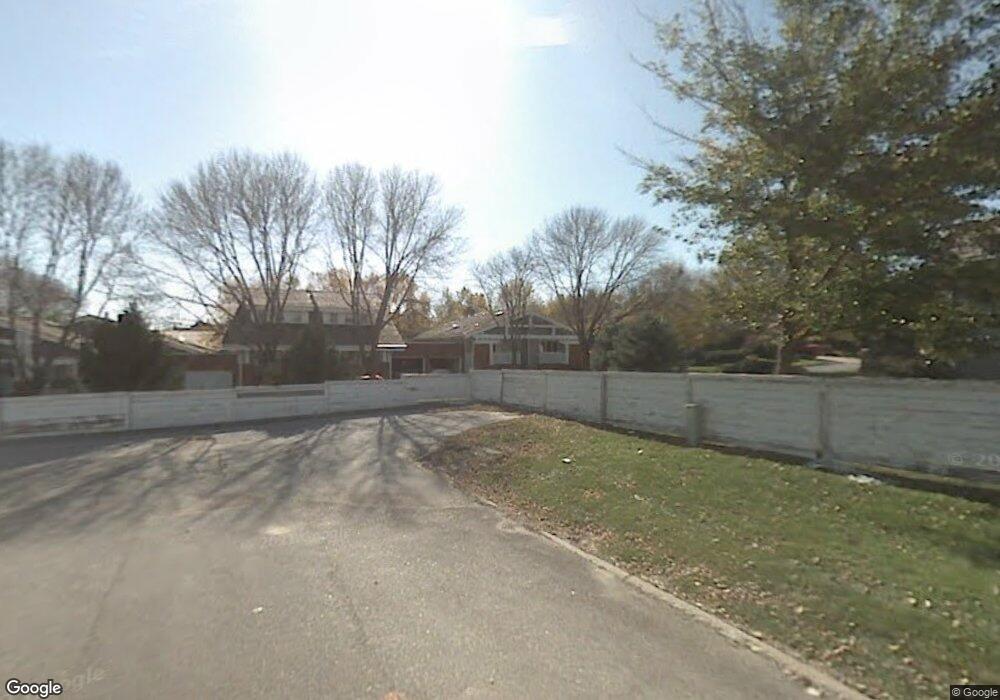
This home is located at 12717 Davenport Plaza, Omaha, NE 68154 and is currently estimated at $374,875, approximately $214 per square foot. 12717 Davenport Plaza is a home located in Douglas County with nearby schools including Columbian Elementary School, Beveridge Magnet Middle School, and Burke High School.
Ownership History
Date
Name
Owned For
Owner Type
Purchase Details
Closed on
Feb 4, 2025
Sold by
Buehler Jean E
Bought by
Martin Jo Ellen and Martin Tye S
Current Estimated Value
Home Financials for this Owner
Home Financials are based on the most recent Mortgage that was taken out on this home.
Original Mortgage
$284,000
Outstanding Balance
$282,043
Interest Rate
6.85%
Mortgage Type
New Conventional
Estimated Equity
$92,832
Purchase Details
Closed on
Jan 29, 2025
Sold by
Jean E Buehler Revocable Trust and Gosnell James
Bought by
Martin Jo Ellen and Martin Tye S
Home Financials for this Owner
Home Financials are based on the most recent Mortgage that was taken out on this home.
Original Mortgage
$284,000
Outstanding Balance
$282,043
Interest Rate
6.85%
Mortgage Type
New Conventional
Estimated Equity
$92,832
Purchase Details
Closed on
Dec 14, 2012
Sold by
Buehler Bruce A and Buehler Jean E
Bought by
Buehler Bruce A and Buehler Jean E
Create a Home Valuation Report for This Property
The Home Valuation Report is an in-depth analysis detailing your home's value as well as a comparison with similar homes in the area
Home Values in the Area
Average Home Value in this Area
Purchase History
| Date | Buyer | Sale Price | Title Company |
|---|---|---|---|
| Martin Jo Ellen | $1,777 | Ambassador Title | |
| Martin Jo Ellen | $355,000 | Ambassador Title | |
| Martin Jo Ellen | -- | Ambassador Title | |
| Buehler Bruce A | -- | None Available |
Source: Public Records
Mortgage History
| Date | Status | Borrower | Loan Amount |
|---|---|---|---|
| Open | Martin Jo Ellen | $284,000 |
Source: Public Records
Tax History Compared to Growth
Tax History
| Year | Tax Paid | Tax Assessment Tax Assessment Total Assessment is a certain percentage of the fair market value that is determined by local assessors to be the total taxable value of land and additions on the property. | Land | Improvement |
|---|---|---|---|---|
| 2025 | $5,627 | $348,000 | $52,600 | $295,400 |
| 2024 | $7,342 | $348,000 | $52,600 | $295,400 |
| 2023 | $7,342 | $348,000 | $52,600 | $295,400 |
| 2022 | $6,173 | $289,200 | $52,600 | $236,600 |
| 2021 | $5,988 | $282,900 | $46,300 | $236,600 |
| 2020 | $6,057 | $282,900 | $46,300 | $236,600 |
| 2019 | $6,075 | $282,900 | $46,300 | $236,600 |
| 2018 | $6,083 | $282,900 | $46,300 | $236,600 |
| 2017 | $6,113 | $282,900 | $46,300 | $236,600 |
| 2016 | $6,193 | $288,600 | $35,400 | $253,200 |
| 2015 | $5,710 | $269,700 | $33,100 | $236,600 |
| 2014 | $5,710 | $269,700 | $33,100 | $236,600 |
Source: Public Records
Map
Nearby Homes
- 223 N 127th Plaza
- 205 N 127th Plaza
- 12305 Douglas Cir
- 705 N 129th Plaza
- 759 N 130th Plaza Unit 2B3
- 719 N 130th Plaza Unit A-11
- 605 S 126th St
- 12924 Izard St
- 805 N 132nd Ave
- 712 S 129th Ave
- 12231 Cuming St
- 12206 Leavenworth Rd
- 647 S 124th St
- 922 N 122nd St
- 210 S 118th St
- 827 S 121st St
- 1325 N 127th Ave
- 921 N 121st St
- 836 S 123rd St
- 835 S 120th Ave
- 12711 Davenport Plaza
- 12727 Davenport Plaza
- 12705 Davenport Plaza
- 12712 Capitol Plaza
- 212 N 127th Plaza
- 12718 Capitol Plaza
- 12728 Davenport Plaza
- 12733 Davenport Plaza
- 217 N 127th Plaza
- 203 N 128th Plaza
- 211 N 127th Plaza
- 120 N 127th Plaza
- 12717 Capitol Plaza
- 12723 Capitol Plaza
- 117 N 127th Plaza
- 309 N 129th St
- 108 S 127th Plaza
- 111 N 127th Plaza
- 319 N 129th St
- 111 N 128th Plaza