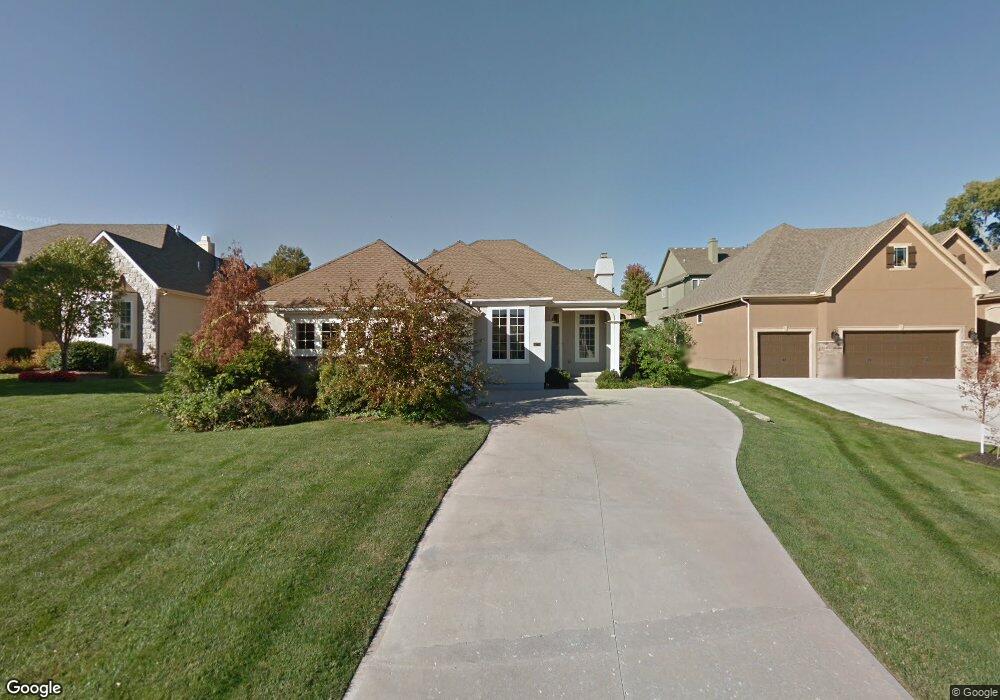
12718 W 49th Terrace Shawnee, KS 66216
Estimated Value: $529,749 - $572,000
3
Beds
3
Baths
1,805
Sq Ft
$307/Sq Ft
Est. Value
About This Home
This home is located at 12718 W 49th Terrace, Shawnee, KS 66216 and is currently estimated at $554,187, approximately $307 per square foot. 12718 W 49th Terrace is a home located in Johnson County with nearby schools including Ray Marsh Elementary School, Trailridge Middle School, and Shawnee Mission Northwest High School.
Ownership History
Date
Name
Owned For
Owner Type
Purchase Details
Closed on
Jun 21, 2007
Sold by
Leabrooke Homes Llc
Bought by
Hamilton Amy L
Current Estimated Value
Home Financials for this Owner
Home Financials are based on the most recent Mortgage that was taken out on this home.
Original Mortgage
$25,000
Outstanding Balance
$15,479
Interest Rate
6.41%
Mortgage Type
Credit Line Revolving
Estimated Equity
$538,708
Purchase Details
Closed on
Jun 19, 2007
Sold by
Price Brothers Residential Inc
Bought by
Leabrooke Homes Llc
Home Financials for this Owner
Home Financials are based on the most recent Mortgage that was taken out on this home.
Original Mortgage
$25,000
Outstanding Balance
$15,479
Interest Rate
6.41%
Mortgage Type
Credit Line Revolving
Estimated Equity
$538,708
Purchase Details
Closed on
Dec 7, 2006
Sold by
Heatherglen Partners Llc
Bought by
Price Brothers Residential Inc
Purchase Details
Closed on
Dec 29, 2005
Sold by
Pflumm 51 Investors Llc
Bought by
Moffitt Development Co Inc
Create a Home Valuation Report for This Property
The Home Valuation Report is an in-depth analysis detailing your home's value as well as a comparison with similar homes in the area
Home Values in the Area
Average Home Value in this Area
Purchase History
| Date | Buyer | Sale Price | Title Company |
|---|---|---|---|
| Hamilton Amy L | -- | Accommodation | |
| Leabrooke Homes Llc | -- | Cbkc Title And Escrow Llc | |
| Price Brothers Residential Inc | -- | None Available | |
| Moffitt Development Co Inc | -- | First American Title Insuran |
Source: Public Records
Mortgage History
| Date | Status | Borrower | Loan Amount |
|---|---|---|---|
| Open | Hamilton Amy L | $25,000 | |
| Closed | Leabrooke Homes Llc | $25,000 |
Source: Public Records
Tax History Compared to Growth
Tax History
| Year | Tax Paid | Tax Assessment Tax Assessment Total Assessment is a certain percentage of the fair market value that is determined by local assessors to be the total taxable value of land and additions on the property. | Land | Improvement |
|---|---|---|---|---|
| 2024 | $5,934 | $55,706 | $11,595 | $44,111 |
| 2023 | $5,809 | $54,084 | $11,041 | $43,043 |
| 2022 | $5,760 | $53,440 | $11,041 | $42,399 |
| 2021 | $5,271 | $46,069 | $10,030 | $36,039 |
| 2020 | $5,378 | $46,402 | $10,030 | $36,372 |
| 2019 | $5,440 | $46,920 | $9,116 | $37,804 |
| 2018 | $5,342 | $45,896 | $9,116 | $36,780 |
| 2017 | $5,240 | $44,321 | $8,334 | $35,987 |
| 2016 | $5,207 | $43,493 | $8,334 | $35,159 |
| 2015 | $4,907 | $42,331 | $8,334 | $33,997 |
| 2013 | -- | $37,087 | $7,576 | $29,511 |
Source: Public Records
Map
Nearby Homes
- 5013 Bradshaw St
- 13305 W 51st St
- 5021 Bradshaw St
- 12023 W 48th St
- 13130 W 52nd Terrace
- 13126 W 52nd Terrace
- 13134 W 52nd Terrace
- 11907 W 49th Place
- W 48th St
- 5407 Halsey St
- 11815 W 53rd St
- 5504 Monrovia St
- 13810 W 53rd St
- 5507 Noland Rd
- 14105 W 48th Terrace
- 12508 W 56th St
- 6804 Woodend Ave
- 11403 W 51st Terrace
- 14210 W 50th St
- 13804 W 55th Terrace
- 12722 W 49th Terrace
- 12714 W 49th Terrace
- 12726 W 49th Terrace
- 12711 W 49th St
- 12717 W 49th St
- 12710 W 49th Terrace
- 12707 W 49th St
- 12719 W 49th Terrace
- 12730 W 49th Terrace
- 12706 W 49th Terrace
- 12723 W 49th St
- 12715 W 49th Terrace
- 4921 Parkhill St
- 12703 W 49th St
- 12709 W 49th Terrace
- 12731 W 49th St
- 4925 Parkhill St
- 4912 Rosehill Dr
- 4908 Rosehill Dr
- 4916 Rosehill Dr