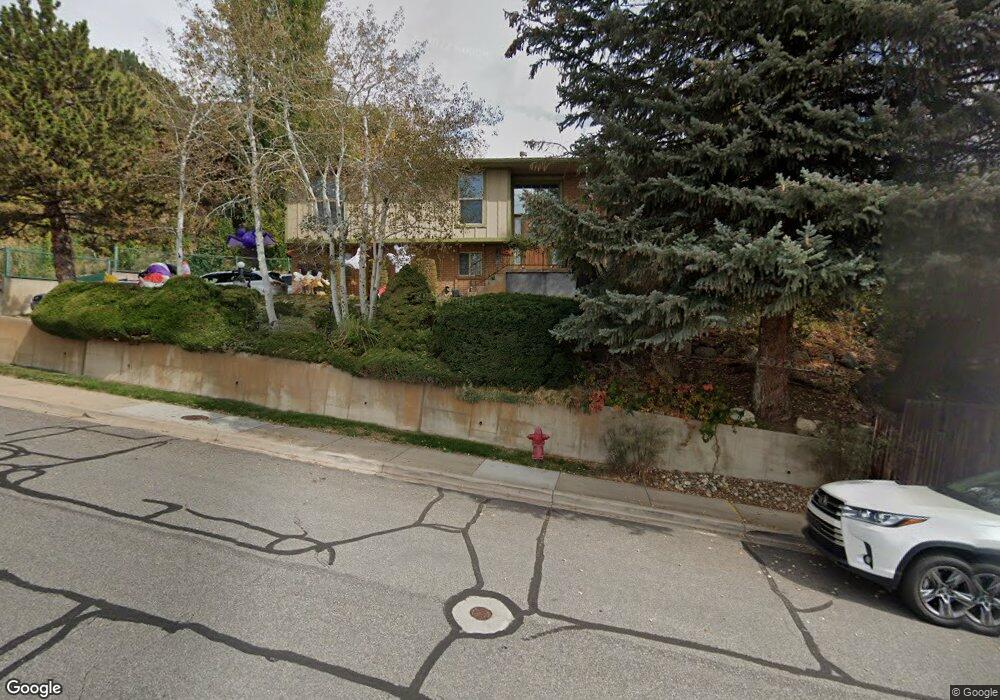
1272 Oakridge Dr Centerville, UT 84014
Estimated Value: $535,000 - $564,649
3
Beds
2
Baths
2,279
Sq Ft
$240/Sq Ft
Est. Value
About This Home
This home is located at 1272 Oakridge Dr, Centerville, UT 84014 and is currently estimated at $547,912, approximately $240 per square foot. 1272 Oakridge Dr is a home located in Davis County with nearby schools including Stewart Elementary School, Centerville Jr High, and Viewmont High School.
Ownership History
Date
Name
Owned For
Owner Type
Purchase Details
Closed on
May 20, 2002
Sold by
Prudential Relocation Inc
Bought by
Anderson Michael A and Anderson Carla S
Current Estimated Value
Home Financials for this Owner
Home Financials are based on the most recent Mortgage that was taken out on this home.
Original Mortgage
$154,850
Outstanding Balance
$65,433
Interest Rate
6.94%
Estimated Equity
$482,479
Purchase Details
Closed on
Dec 21, 2001
Sold by
Mason Mark and Mason Clarisse
Bought by
Prudential Relocation Inc
Purchase Details
Closed on
Mar 25, 1998
Sold by
England Donna E
Bought by
Mason Mark and Mason Clarisse
Home Financials for this Owner
Home Financials are based on the most recent Mortgage that was taken out on this home.
Original Mortgage
$127,200
Interest Rate
7.06%
Create a Home Valuation Report for This Property
The Home Valuation Report is an in-depth analysis detailing your home's value as well as a comparison with similar homes in the area
Purchase History
| Date | Buyer | Sale Price | Title Company |
|---|---|---|---|
| Anderson Michael A | -- | Bonneville Title Company Inc | |
| Prudential Relocation Inc | -- | Bonneville Title Company Inc | |
| Mason Mark | -- | First American Title Co |
Source: Public Records
Mortgage History
| Date | Status | Borrower | Loan Amount |
|---|---|---|---|
| Open | Anderson Michael A | $154,850 | |
| Previous Owner | Mason Mark | $127,200 |
Source: Public Records
Tax History
| Year | Tax Paid | Tax Assessment Tax Assessment Total Assessment is a certain percentage of the fair market value that is determined by local assessors to be the total taxable value of land and additions on the property. | Land | Improvement |
|---|---|---|---|---|
| 2025 | $3,274 | $284,350 | $184,647 | $99,703 |
| 2024 | $3,105 | $276,650 | $169,243 | $107,407 |
| 2023 | $2,898 | $470,000 | $286,317 | $183,683 |
| 2022 | $3,023 | $272,250 | $145,491 | $126,759 |
| 2021 | $2,806 | $393,000 | $227,196 | $165,804 |
| 2020 | $2,432 | $338,000 | $219,318 | $118,682 |
| 2019 | $2,364 | $323,000 | $211,334 | $111,666 |
| 2018 | $2,173 | $293,000 | $195,640 | $97,360 |
| 2016 | $1,808 | $137,665 | $70,514 | $67,151 |
| 2015 | $1,767 | $128,205 | $70,514 | $57,691 |
| 2014 | $1,564 | $116,688 | $70,211 | $46,477 |
| 2013 | -- | $117,541 | $52,337 | $65,204 |
Source: Public Records
Map
Nearby Homes
- 1290 Oakridge Dr
- 1366 Cottonwood Dr
- 984 N 500 E
- 145 Ford Canyon Dr
- 243 Balsam Dr
- 66 Brookside Ln
- 775 Pheasantbrook Cir
- 563 N 220 E
- 290 W 1350 N
- 165 W Pheasantbrook Dr
- 271 Brookfield Ln
- 371 W 1125 N
- 1238 N 450 W
- 380 E 400 N
- 781 Pheasantbrook Dr
- 292 W 680 N
- 281 W 650 N Unit B
- 252 N 400 E
- 282 W 605 N Unit A
- 282 W 605 N Unit I
- 1272 Oakridge Dr
- 1258 Oakridge Dr
- 1322 Oakridge Dr
- 1262 N 400 E
- 1236 Oakridge Dr
- 1262 Nola Cir
- 1248 N 400 E
- 1287 Oakridge Dr
- 1287 Oakridge Dr Unit 24
- 1333 Oakridge Dr
- 1333 Oakridge Dr
- 1346 Oakridge Dr
- 1284 N 400 E
- 543 E 1200 N
- 1346 Oakridge Dr
- 1212 Oakridge Dr
- 519 Barnard St
- 1232 N 400 E
- 1232 Nola Cir
- 1088 Oakridge Dr Unit 5
Your Personal Tour Guide
Ask me questions while you tour the home.