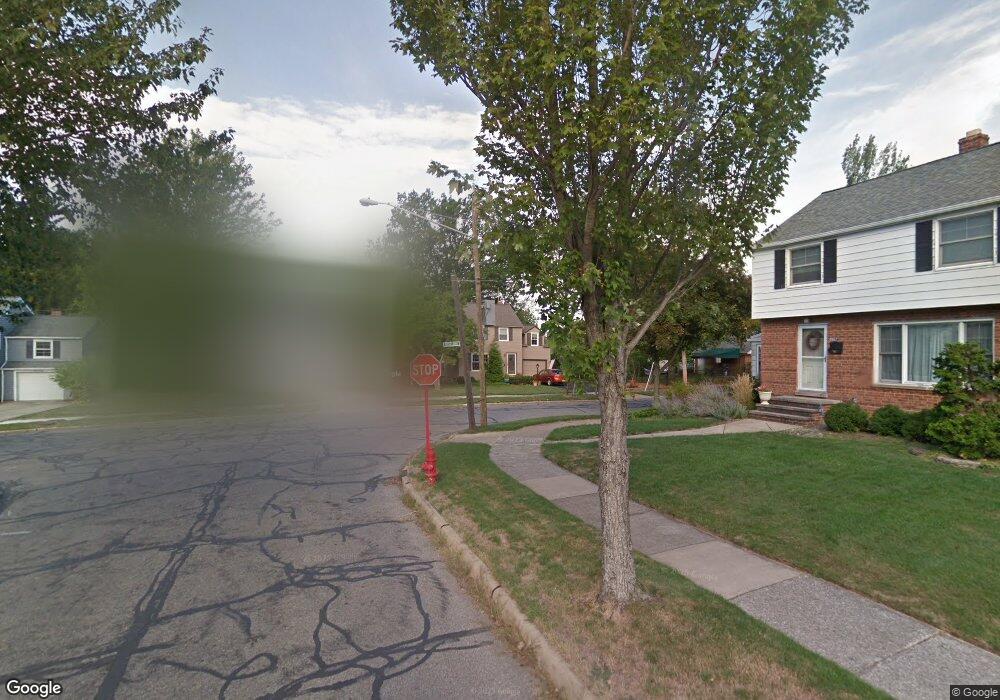
1272 Roselawn Rd Cleveland, OH 44124
Estimated Value: $179,483 - $194,000
3
Beds
1
Bath
980
Sq Ft
$191/Sq Ft
Est. Value
About This Home
This home is located at 1272 Roselawn Rd, Cleveland, OH 44124 and is currently estimated at $187,621, approximately $191 per square foot. 1272 Roselawn Rd is a home located in Cuyahoga County with nearby schools including Greenview Upper Elementary School, Sunview Elementary School, and Memorial Junior High School.
Ownership History
Date
Name
Owned For
Owner Type
Purchase Details
Closed on
Aug 16, 2004
Sold by
Brandais Roger F and Brandais Roger
Bought by
Vogley Sean E
Current Estimated Value
Home Financials for this Owner
Home Financials are based on the most recent Mortgage that was taken out on this home.
Original Mortgage
$93,200
Outstanding Balance
$46,523
Interest Rate
6.1%
Mortgage Type
Purchase Money Mortgage
Estimated Equity
$141,098
Purchase Details
Closed on
Apr 5, 1993
Sold by
Brandais Roger F
Bought by
Brandais Roger F
Purchase Details
Closed on
Jul 31, 1991
Sold by
Bowe Carle A and Bowe Thomas W
Bought by
Brandais Roger F
Purchase Details
Closed on
Sep 17, 1985
Sold by
Kane Kathleen
Bought by
Bowe Carle A and Bowe Thomas W
Purchase Details
Closed on
Apr 27, 1977
Sold by
Hollingsworth Donald R and M K
Bought by
Kane Kathleen
Purchase Details
Closed on
Jan 1, 1975
Bought by
Hollingsworth Donald R and M K
Create a Home Valuation Report for This Property
The Home Valuation Report is an in-depth analysis detailing your home's value as well as a comparison with similar homes in the area
Home Values in the Area
Average Home Value in this Area
Purchase History
| Date | Buyer | Sale Price | Title Company |
|---|---|---|---|
| Vogley Sean E | $116,500 | Executive Title Agency | |
| Brandais Roger F | -- | -- | |
| Brandais Roger F | $69,000 | -- | |
| Bowe Carle A | $59,000 | -- | |
| Kane Kathleen | $42,000 | -- | |
| Hollingsworth Donald R | -- | -- |
Source: Public Records
Mortgage History
| Date | Status | Borrower | Loan Amount |
|---|---|---|---|
| Open | Vogley Sean E | $93,200 |
Source: Public Records
Tax History Compared to Growth
Tax History
| Year | Tax Paid | Tax Assessment Tax Assessment Total Assessment is a certain percentage of the fair market value that is determined by local assessors to be the total taxable value of land and additions on the property. | Land | Improvement |
|---|---|---|---|---|
| 2024 | $3,878 | $55,160 | $14,490 | $40,670 |
| 2023 | $3,584 | $41,030 | $11,310 | $29,720 |
| 2022 | $3,563 | $41,020 | $11,310 | $29,720 |
| 2021 | $3,533 | $41,020 | $11,310 | $29,720 |
| 2020 | $3,314 | $33,640 | $9,280 | $24,360 |
| 2019 | $2,989 | $96,100 | $26,500 | $69,600 |
| 2018 | $2,973 | $33,640 | $9,280 | $24,360 |
| 2017 | $3,051 | $31,750 | $9,240 | $22,510 |
| 2016 | $3,027 | $31,750 | $9,240 | $22,510 |
| 2015 | $3,062 | $31,750 | $9,240 | $22,510 |
| 2014 | $3,062 | $32,380 | $9,420 | $22,960 |
Source: Public Records
Map
Nearby Homes
- 4800 Farnhurst Rd
- 1271 Dorsh Rd
- 4866 Fairlawn Rd
- 1333 Clearview Rd
- 4781 Dorshwood Rd
- 4669 Liberty Rd
- 4650 Liberty Rd
- 4769 Edenwood Rd
- 4695 Mayfield Rd Unit A
- 1512 Parkside Cir
- 4685 Mayfield Rd Unit F
- 5103 Eastover Rd
- 981 Hanley Rd
- 1503 Oakmount Rd
- 4591 Wilburn Dr
- 5027 Bristol Ct
- 5079 Haverford Dr
- 4742 Anderson Rd
- 4493 Telhurst Rd
- 4561 Wilburn Dr
- 1276 Roselawn Rd
- 4852 Edsal Dr
- 4856 Edsal Dr
- 1280 Roselawn Rd
- 4848 Edsal Dr
- 4867 Oakland Dr
- 4844 Edsal Dr
- 1286 Roselawn Rd
- 4868 Edsal Dr
- 4871 Oakland Dr
- 4868 Oakland Dr
- 4836 Edsal Dr
- 4872 Edsal Dr
- 4872 Oakland Dr
- 4879 Oakland Dr
- 4832 Edsal Dr
- 4876 Edsal Dr
- 4880 Oakland Dr
- 4851 Westbourne Rd
- 4851 Edsal Dr