
Seller's Agent in 2021
Debbie Krueger
Coldwell Banker Realty
(630) 674-4191
15 Total Sales

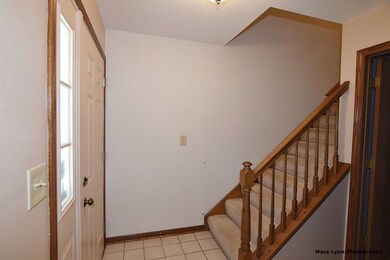
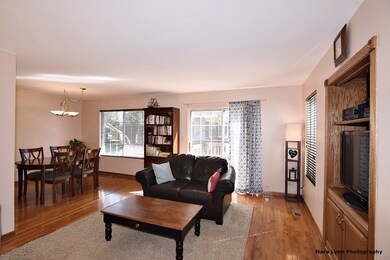
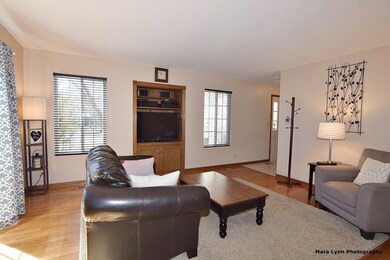
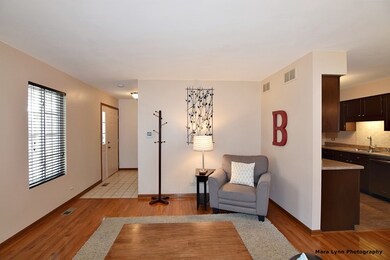

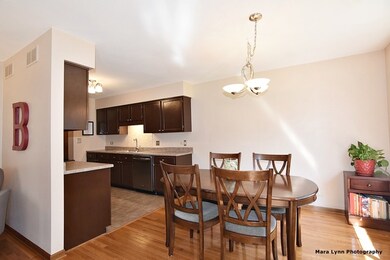
Wow! What an absolutely gorgeous end-unit home in a great neighborhood! Hardwood floors in the family room and dining room, remodeled kitchen with newer stainless steel appliances! Updated powder room! Two bedrooms upstairs both with walk-in closets - huge master bedroom! Awesome finished basement plus laundry room and storage! Newer furnace and water heater! Water filtration system! Attached one car garage! Newer deck off of the kitchen! Covered front porch! Great location close to ECC, Randall Road, Fox River, shopping and restaurants! Wow!
Last Agent to Sell the Property
RE/MAX All Pro - St Charles License #475125795 Listed on: 04/04/2016
| Date | Type | Sale Price | Title Company |
|---|---|---|---|
| Warranty Deed | $205,000 | Burnet Title | |
| Warranty Deed | $148,000 | Fidelity National Title | |
| Interfamily Deed Transfer | -- | Stewart Title Company | |
| Warranty Deed | $138,000 | -- |
| Date | Status | Loan Amount | Loan Type |
|---|---|---|---|
| Previous Owner | $180,000 | New Conventional | |
| Previous Owner | $7,500 | Stand Alone Second | |
| Previous Owner | $140,300 | New Conventional | |
| Previous Owner | $154,200 | New Conventional | |
| Previous Owner | $151,000 | Unknown | |
| Previous Owner | $150,100 | Unknown | |
| Previous Owner | $130,700 | No Value Available |
| Date | Event | Price | Change | Sq Ft Price |
|---|---|---|---|---|
| 06/30/2021 06/30/21 | Sold | $205,000 | +7.9% | $168 / Sq Ft |
| 05/17/2021 05/17/21 | For Sale | -- | -- | -- |
| 05/16/2021 05/16/21 | Pending | -- | -- | -- |
| 05/13/2021 05/13/21 | For Sale | $190,000 | +28.6% | $156 / Sq Ft |
| 06/17/2016 06/17/16 | Sold | $147,800 | -1.3% | $121 / Sq Ft |
| 04/13/2016 04/13/16 | Pending | -- | -- | -- |
| 04/04/2016 04/04/16 | For Sale | $149,800 | -- | $123 / Sq Ft |
| Year | Tax Paid | Tax Assessment Tax Assessment Total Assessment is a certain percentage of the fair market value that is determined by local assessors to be the total taxable value of land and additions on the property. | Land | Improvement |
|---|---|---|---|---|
| 2023 | $4,352 | $59,876 | $15,516 | $44,360 |
| 2022 | $4,182 | $54,597 | $14,148 | $40,449 |
| 2021 | $3,923 | $51,044 | $13,227 | $37,817 |
| 2020 | $3,641 | $47,010 | $12,627 | $34,383 |
| 2019 | $3,494 | $44,780 | $12,028 | $32,752 |
| 2018 | $3,410 | $42,185 | $11,331 | $30,854 |
| 2017 | $3,226 | $39,880 | $10,712 | $29,168 |
| 2016 | $3,051 | $36,998 | $9,938 | $27,060 |
| 2015 | -- | $33,912 | $9,109 | $24,803 |
| 2014 | -- | $31,471 | $8,997 | $22,474 |
| 2013 | -- | $32,301 | $9,234 | $23,067 |
Seller's Agent in 2021
Debbie Krueger
Coldwell Banker Realty
(630) 674-4191
15 Total Sales
Buyer's Agent in 2021
Katie Fish
Keller Williams Inspire - Geneva
(847) 560-3474
341 Total Sales
Seller's Agent in 2016
Mary Reuter Kenney
RE/MAX
(630) 204-5539
144 Total Sales
Buyer's Agent in 2016
Russ Nelms
Coldwell Banker Realty
(847) 409-9091
8 Total Sales
Source: Midwest Real Estate Data (MRED)
MLS Number: MRD09183823
APN: 06-34-102-052
Disclaimer: Certain information contained herein is derived from information provided by parties other than Homes.com. All information provided is deemed reliable, but is not guaranteed to be accurate and should be independently verified.
![]() Based on information submitted to the MLS GRID. All data is obtained from various sources and may not have been verified by broker or MLS GRID. Supplied Open House Information is subject to change without notice. All information should be independently reviewed and verified for accuracy. Properties may or may not be listed by the office/agent presenting the information. Some IDX listings have been excluded from this website.
Based on information submitted to the MLS GRID. All data is obtained from various sources and may not have been verified by broker or MLS GRID. Supplied Open House Information is subject to change without notice. All information should be independently reviewed and verified for accuracy. Properties may or may not be listed by the office/agent presenting the information. Some IDX listings have been excluded from this website.
The Digital Millennium Copyright Act of 1998, 17 U.S.C. § 512 (the “DMCA”) provides recourse for copyright owners who believe that material appearing on the Internet infringes their rights under U.S. copyright law. If you believe in good faith that any content or material made available in connection with our website or services infringes your copyright, you (or your agent) may send us a notice requesting that the content or material be removed, or access to it blocked.
Notices must be sent in writing by email to DMCAnotice@MLSGrid.com.
The DMCA requires that your notice of alleged copyright infringement include the following information:
(1) description of the copyrighted work that is the subject of claimed infringement;
(2) description of the alleged infringing content and information sufficient to permit us to locate the content;
(3) contact information for you, including your address, telephone number and email address;
(4) a statement by you that you have a good faith belief that the content in the manner complained of is not authorized by the copyright owner, or its agent, or by the operation of any law;
(5) a statement by you, signed under penalty of perjury, that the information in the notification is accurate and that you have the authority to enforce the copyrights that are claimed to be infringed; and
(6) a physical or electronic signature of the copyright owner or a person authorized to act on the copyright owner’s behalf. Failure to include all of the above information may result in the delay of the processing of your complaint.