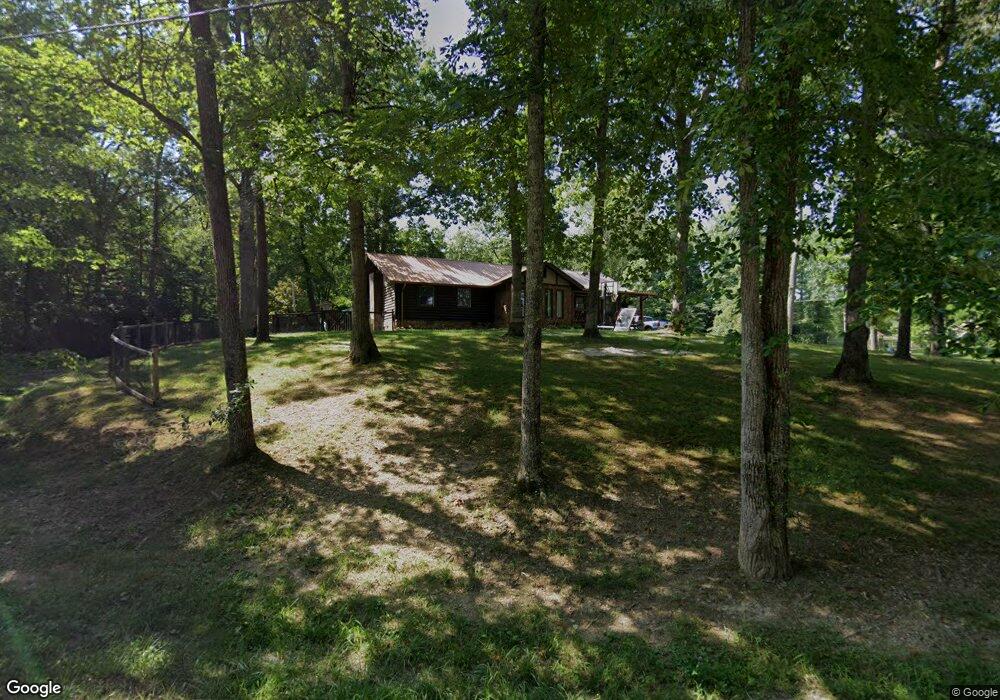
1272 Terry Rd Oneida, TN 37841
Estimated Value: $218,256 - $278,000
--
Bed
1
Bath
1,648
Sq Ft
$147/Sq Ft
Est. Value
About This Home
This home is located at 1272 Terry Rd, Oneida, TN 37841 and is currently estimated at $242,814, approximately $147 per square foot. 1272 Terry Rd is a home with nearby schools including Scott High School and Landmark Christian Academy.
Ownership History
Date
Name
Owned For
Owner Type
Purchase Details
Closed on
Nov 22, 2019
Sold by
Marlar Cameron
Bought by
Chambers Raelii S and Chambers Gabriel R
Current Estimated Value
Home Financials for this Owner
Home Financials are based on the most recent Mortgage that was taken out on this home.
Original Mortgage
$152,290
Outstanding Balance
$133,342
Interest Rate
3.75%
Mortgage Type
FHA
Estimated Equity
$109,472
Purchase Details
Closed on
Dec 14, 2017
Sold by
Marlar David
Bought by
Marlar Cameron
Purchase Details
Closed on
Nov 1, 2011
Sold by
Bankston Kimberly Denise
Bought by
Bankston William Kyle
Purchase Details
Closed on
Feb 6, 2002
Bought by
Bankston Kimberly Denise
Purchase Details
Closed on
Jul 3, 1998
Bought by
Bankston Kim and Bankston Nancy
Purchase Details
Closed on
Sep 21, 1988
Purchase Details
Closed on
Sep 4, 1980
Bought by
Cryderman Doreen Shirley
Create a Home Valuation Report for This Property
The Home Valuation Report is an in-depth analysis detailing your home's value as well as a comparison with similar homes in the area
Home Values in the Area
Average Home Value in this Area
Purchase History
| Date | Buyer | Sale Price | Title Company |
|---|---|---|---|
| Chambers Raelii S | $155,100 | -- | |
| Marlar Cameron | -- | -- | |
| Bankston William Kyle | -- | -- | |
| Bankston Kimberly Denise | $42,000 | -- | |
| Bankston Kim | $70,000 | -- | |
| -- | $57,000 | -- | |
| Cryderman Doreen Shirley | -- | -- |
Source: Public Records
Mortgage History
| Date | Status | Borrower | Loan Amount |
|---|---|---|---|
| Open | Chambers Raelii S | $152,290 |
Source: Public Records
Tax History Compared to Growth
Tax History
| Year | Tax Paid | Tax Assessment Tax Assessment Total Assessment is a certain percentage of the fair market value that is determined by local assessors to be the total taxable value of land and additions on the property. | Land | Improvement |
|---|---|---|---|---|
| 2024 | -- | $46,150 | $3,525 | $42,625 |
| 2023 | $1,316 | $46,150 | $3,525 | $42,625 |
| 2022 | $806 | $20,350 | $3,450 | $16,900 |
| 2021 | $776 | $20,350 | $3,450 | $16,900 |
| 2020 | $0 | $20,350 | $3,450 | $16,900 |
| 2019 | $711 | $20,350 | $3,450 | $16,900 |
| 2018 | $711 | $20,350 | $3,450 | $16,900 |
| 2017 | $872 | $24,950 | $3,850 | $21,100 |
| 2016 | $849 | $24,950 | $3,850 | $21,100 |
| 2015 | $819 | $24,950 | $3,850 | $21,100 |
| 2014 | $819 | $24,950 | $3,850 | $21,100 |
Source: Public Records
Map
Nearby Homes
- 126 Pullman Ln
- 605 S Lake Dr
- 0 Cook Ave
- 420 Southern Ln
- 253 Hilltop Dr
- 0 Hilltop Dr
- 0 Marcum Rd
- 120 Wright St
- 290 Landmark Rd
- 103 Shelton Ln
- 145 Shelton Ln
- 200 Burnett Ln
- 610 Paint Rock Rd
- 376 Choate Ln
- 069 145.00 Letner Rd
- 562 Verdun Rd
- 0 Buffalo Rd Unit 11503602
- 0 Buffalo Rd Unit 23634322
- 0 Buffalo Rd Unit 1310923
- 0 Edgewood Blvd
- 150 Marlin Keeton Dr
- 1348 Terry Rd
- 185 Fairway Ln
- 211 Fairway Ln
- 383 Sunny Ln
- 0 Terry(aka 1442 Terry Rd) Rd
- 245 Fairway Ln
- 1442 Terry Rd
- 672 N Lake Dr
- 263 Fairway Ln
- 333 Sunny Ln
- 725 N Lake Dr
- 250 Sunny Ln
- 673 N Lake Dr
- 246 Sunny Ln
- 1454 Terry Rd
- 1528 Terry Rd
- 237 Sunny Ln
- 367 Fairway Ln
- 401 Fairway Ln