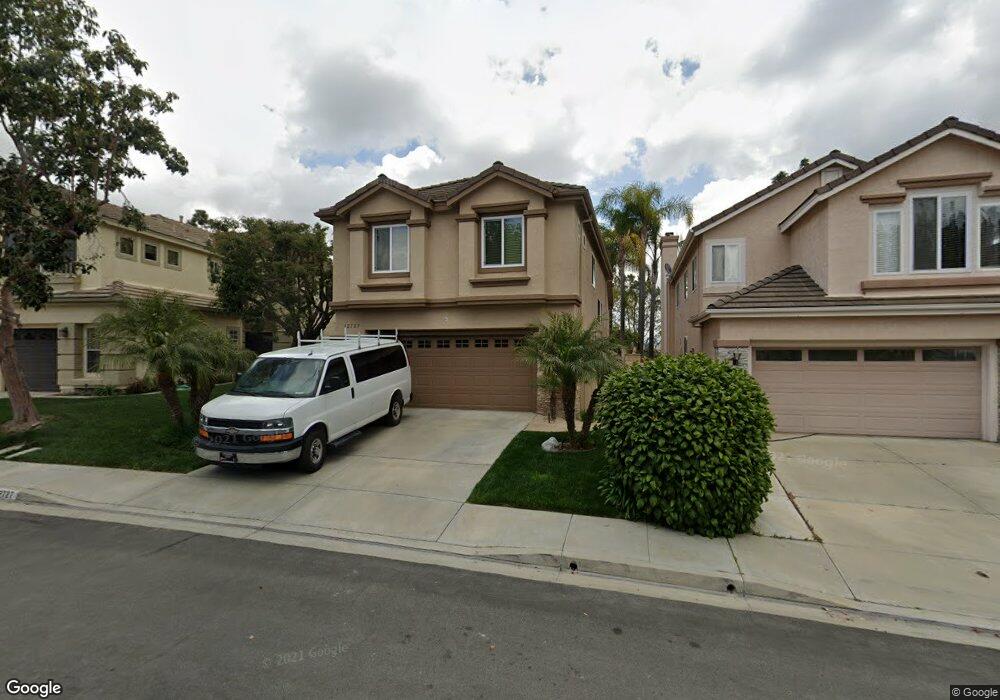
12727 Calle de la Siena San Diego, CA 92130
Carmel Valley NeighborhoodEstimated Value: $1,700,000 - $2,106,000
4
Beds
3
Baths
2,075
Sq Ft
$910/Sq Ft
Est. Value
About This Home
This home is located at 12727 Calle de la Siena, San Diego, CA 92130 and is currently estimated at $1,887,249, approximately $909 per square foot. 12727 Calle de la Siena is a home located in San Diego County with nearby schools including Carmel Creek Elementary School, Solana Pacific Elementary School, and Carmel Valley Middle School.
Ownership History
Date
Name
Owned For
Owner Type
Purchase Details
Closed on
Nov 10, 2022
Sold by
Halpern Stephen J and Halpern Iris L
Bought by
Stephen J Halpern And Iris L Bernard Revocabl
Current Estimated Value
Purchase Details
Closed on
Apr 9, 2002
Sold by
Halpern Stephen J and Bernard Iris L
Bought by
Halpern Stephen J and Bernard Iris L
Home Financials for this Owner
Home Financials are based on the most recent Mortgage that was taken out on this home.
Original Mortgage
$250,000
Interest Rate
6.78%
Purchase Details
Closed on
Oct 4, 1997
Sold by
Halpern Stephen J and Halpern Bernard L
Bought by
Halpern Stephen J and Bernard Iris L
Purchase Details
Closed on
Jun 21, 1994
Sold by
Pardee Construction Company
Bought by
Halpern Stephen J and Bernard Iris L
Home Financials for this Owner
Home Financials are based on the most recent Mortgage that was taken out on this home.
Original Mortgage
$268,650
Interest Rate
8.8%
Create a Home Valuation Report for This Property
The Home Valuation Report is an in-depth analysis detailing your home's value as well as a comparison with similar homes in the area
Home Values in the Area
Average Home Value in this Area
Purchase History
| Date | Buyer | Sale Price | Title Company |
|---|---|---|---|
| Stephen J Halpern And Iris L Bernard Revocabl | -- | -- | |
| Halpern Stephen J | -- | Old Republic Title | |
| Halpern Stephen J | -- | -- | |
| Halpern Stephen J | $336,000 | First American Title |
Source: Public Records
Mortgage History
| Date | Status | Borrower | Loan Amount |
|---|---|---|---|
| Previous Owner | Halpern Stephen J | $250,000 | |
| Previous Owner | Halpern Stephen J | $268,650 |
Source: Public Records
Tax History Compared to Growth
Tax History
| Year | Tax Paid | Tax Assessment Tax Assessment Total Assessment is a certain percentage of the fair market value that is determined by local assessors to be the total taxable value of land and additions on the property. | Land | Improvement |
|---|---|---|---|---|
| 2025 | $7,195 | $563,513 | $277,137 | $286,376 |
| 2024 | $7,195 | $552,464 | $271,703 | $280,761 |
| 2023 | $7,186 | $541,632 | $266,376 | $275,256 |
| 2022 | $7,054 | $531,012 | $261,153 | $269,859 |
| 2021 | $6,954 | $520,601 | $256,033 | $264,568 |
| 2020 | $6,905 | $515,264 | $253,408 | $261,856 |
| 2019 | $6,798 | $505,162 | $248,440 | $256,722 |
| 2018 | $6,694 | $495,258 | $243,569 | $251,689 |
| 2017 | $6,603 | $485,548 | $238,794 | $246,754 |
| 2016 | $6,288 | $476,028 | $234,112 | $241,916 |
| 2015 | $6,214 | $468,879 | $230,596 | $238,283 |
| 2014 | $6,114 | $459,695 | $226,079 | $233,616 |
Source: Public Records
Map
Nearby Homes
- 3965 Via Holgura
- 12370 Carmel Country Rd Unit 202
- 12372 Carmel Country Rd Unit 207
- 12372 Carmel Country Rd Unit 202
- 12368 Carmel Country Rd Unit 303
- 4436 Heritage Glen Ln
- 4271 Corte Favor
- 12364 Carmel Country Rd Unit C306
- 12936 Carmel Creek Rd Unit 63
- 12620 Carmel Country Rd Unit 74
- 3718 Mykonos Ln Unit 158
- 3877 Pell Place Unit 424
- 3857 Pell Place Unit 406
- 12550 Carmel Creek Rd Unit 100
- 12436 Cavallo St
- 12518 Cavallo St
- 4049 Carmel View Rd Unit 74
- 4049 Carmel View Rd Unit 75
- 3975 San Gregorio Way
- 12585 Ruette Alliante Unit 152
- 12723 Calle de la Siena
- 12731 Calle de la Siena
- 12719 Calle de la Siena
- 12735 Calle de la Siena
- 12715 Calle de la Siena
- 12739 Calle de la Siena
- 12726 Calle de la Siena
- 12718 Calle de la Siena
- 12743 Calle de la Siena
- 12709 Calle de la Siena
- 12730 Calle de la Siena
- 12738 Calle de la Siena
- 12747 Calle de la Siena
- 12705 Calle de la Siena
- 4309 Corte de la Fonda
- 12742 Calle de la Siena
- 4247 Plaza de la Siena
- 4220 Plaza de la Siena
- 4235 Plaza de la Siena
- 12751 Calle de la Siena