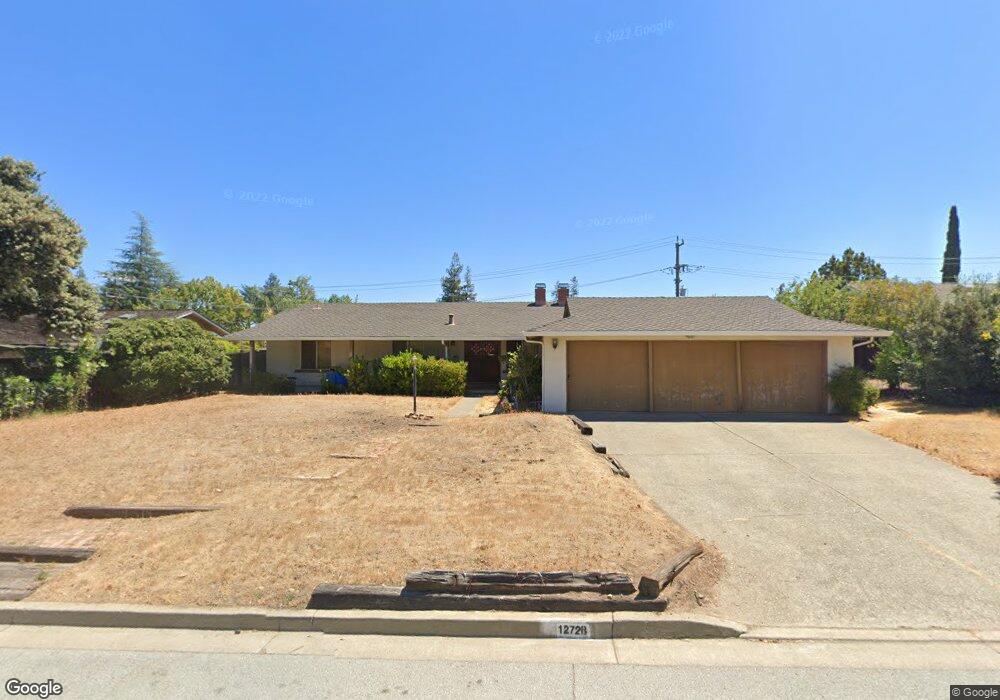
12728 Cambridge Dr Saratoga, CA 95070
West San Jose NeighborhoodEstimated Value: $3,572,000 - $4,077,000
4
Beds
2
Baths
1,880
Sq Ft
$1,984/Sq Ft
Est. Value
About This Home
This home is located at 12728 Cambridge Dr, Saratoga, CA 95070 and is currently estimated at $3,729,990, approximately $1,984 per square foot. 12728 Cambridge Dr is a home located in Santa Clara County with nearby schools including Argonaut Elementary School, Foothill Elementary School, and Saratoga Elementary School.
Ownership History
Date
Name
Owned For
Owner Type
Purchase Details
Closed on
Jan 12, 2018
Sold by
Doung Chun Fa and Kuo Bin
Bought by
Doung Chun Fa and Kuo Bin
Current Estimated Value
Purchase Details
Closed on
Jun 4, 2010
Sold by
Doung Chun Fa and Kuo Bin
Bought by
Doung Chun Fa and Kuo Bin
Home Financials for this Owner
Home Financials are based on the most recent Mortgage that was taken out on this home.
Original Mortgage
$695,000
Outstanding Balance
$467,160
Interest Rate
5.03%
Mortgage Type
New Conventional
Estimated Equity
$3,262,830
Purchase Details
Closed on
Oct 18, 1993
Sold by
Doung Chun Fa and Doung Bin Kuo
Bought by
Doung Chun Fa and Doung Bin Kuo
Home Financials for this Owner
Home Financials are based on the most recent Mortgage that was taken out on this home.
Original Mortgage
$185,000
Interest Rate
6.95%
Create a Home Valuation Report for This Property
The Home Valuation Report is an in-depth analysis detailing your home's value as well as a comparison with similar homes in the area
Home Values in the Area
Average Home Value in this Area
Purchase History
| Date | Buyer | Sale Price | Title Company |
|---|---|---|---|
| Doung Chun Fa | -- | None Available | |
| Doung Chun Fa | -- | Chicago Title Company | |
| Doung Chun Fa | -- | First American Title Guarant |
Source: Public Records
Mortgage History
| Date | Status | Borrower | Loan Amount |
|---|---|---|---|
| Open | Doung Chun Fa | $695,000 | |
| Closed | Doung Chun Fa | $185,000 |
Source: Public Records
Tax History Compared to Growth
Tax History
| Year | Tax Paid | Tax Assessment Tax Assessment Total Assessment is a certain percentage of the fair market value that is determined by local assessors to be the total taxable value of land and additions on the property. | Land | Improvement |
|---|---|---|---|---|
| 2025 | $11,022 | $880,619 | $442,078 | $438,541 |
| 2024 | $11,022 | $863,353 | $433,410 | $429,943 |
| 2023 | $10,850 | $846,425 | $424,912 | $421,513 |
| 2022 | $10,645 | $829,830 | $416,581 | $413,249 |
| 2021 | $10,534 | $813,560 | $408,413 | $405,147 |
| 2020 | $10,302 | $805,219 | $404,226 | $400,993 |
| 2019 | $10,119 | $789,431 | $396,300 | $393,131 |
| 2018 | $9,843 | $773,953 | $388,530 | $385,423 |
| 2017 | $9,789 | $758,778 | $380,912 | $377,866 |
| 2016 | $9,478 | $743,901 | $373,444 | $370,457 |
| 2015 | $9,263 | $732,728 | $367,835 | $364,893 |
| 2014 | $9,048 | $718,376 | $360,630 | $357,746 |
Source: Public Records
Map
Nearby Homes
- 13010 Glen Brae Dr
- 19437 Via Real Dr
- 19423 Vineyard Ln
- 19113 Vineyard Ln
- 19662 Via Grande Dr
- 12790 Glen Arbor Ct
- 12140 Woodside Dr
- 1681 Danromas Way
- 11010 Maple Place Unit 25-06 Plan 4
- 10750 Elm Cir Unit 88-17 Plan 2
- 10730 Elm Cir Unit 86-17 Plan 2
- Plan 2 at The Elms
- Plan 3 at The Elms
- Plan 4 at The Elms
- 11645 Redwood Place Unit 56-12 Plan 4
- 11315 Cottonwood Place Unit 39-09 Plan 3
- 19920 Viewridge Dr
- 11210 Cottonwood Place Unit 35-08 Plan 4
- 11115 Maple Place Unit 30-07
- 11220 Cottonwood Place Unit 36-08 Plan 2
- 12746 Cambridge Dr
- 12702 Cambridge Dr
- 12713 Miller Ave
- 12725 Miller Ave
- 12690 Cambridge Dr
- 12768 Cambridge Dr
- 12723 Cambridge Dr
- 12681 Miller Ave
- 12747 Miller Ave
- 12701 Cambridge Dr
- 12745 Cambridge Dr
- 12689 Cambridge Dr
- 12767 Cambridge Dr
- 12669 Miller Ave
- 19467 Brockton Ln
- 19489 Brockton Ln
- 19445 Brockton Ln
- 12712 Miller Ave
- 19423 Brockton Ln
- 12724 Plymouth Dr