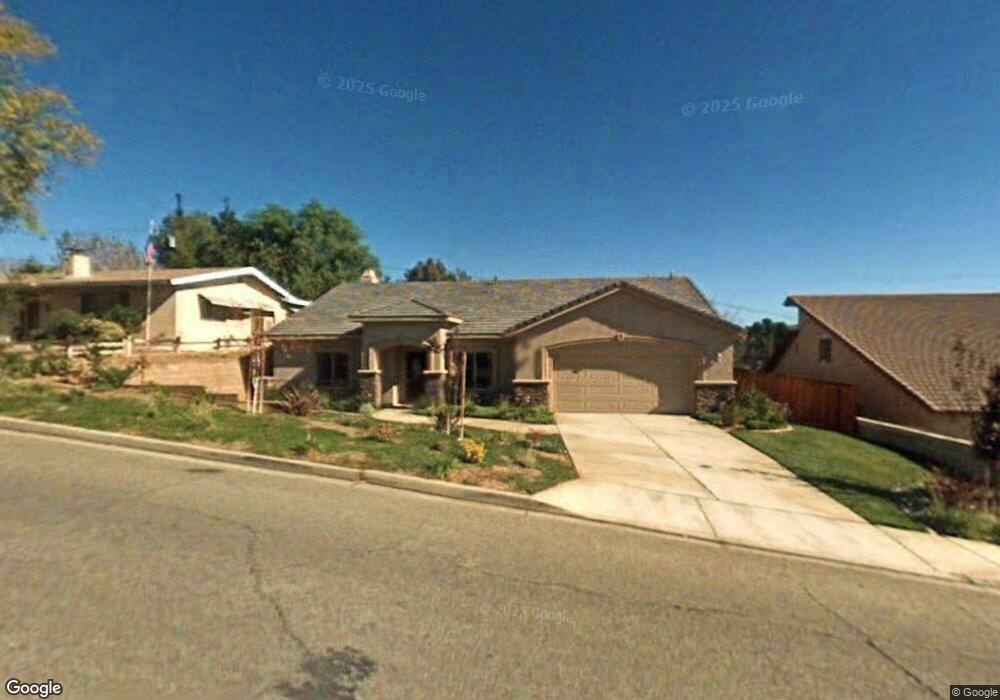
1273 3rd St Calimesa, CA 92320
Estimated Value: $607,930 - $633,000
3
Beds
2
Baths
2,107
Sq Ft
$294/Sq Ft
Est. Value
About This Home
This home is located at 1273 3rd St, Calimesa, CA 92320 and is currently estimated at $619,233, approximately $293 per square foot. 1273 3rd St is a home located in Riverside County with nearby schools including Calimesa Elementary, Mesa View Middle School, and Yucaipa High School.
Ownership History
Date
Name
Owned For
Owner Type
Purchase Details
Closed on
May 18, 2007
Sold by
De Sousa Development Inc
Bought by
Tyler Kenneth
Current Estimated Value
Home Financials for this Owner
Home Financials are based on the most recent Mortgage that was taken out on this home.
Original Mortgage
$351,200
Outstanding Balance
$214,090
Interest Rate
6.21%
Mortgage Type
New Conventional
Estimated Equity
$405,143
Purchase Details
Closed on
Apr 18, 2005
Sold by
Childers Christina Fawn and Childers Jack D
Bought by
De Sousa Development Inc
Purchase Details
Closed on
Jan 7, 2004
Sold by
Childers Christina Fawn
Bought by
Childers Christina Fawn and Childers Jack D
Purchase Details
Closed on
Dec 3, 2003
Sold by
Butler Olga P
Bought by
Childers Christina Fawn
Purchase Details
Closed on
Mar 13, 2002
Sold by
The Butler Family Living Trust
Bought by
The Butler Family Living Trust
Purchase Details
Closed on
Dec 12, 1995
Sold by
Butler Olga
Bought by
Butler Jeri R and Butler Olga P
Create a Home Valuation Report for This Property
The Home Valuation Report is an in-depth analysis detailing your home's value as well as a comparison with similar homes in the area
Home Values in the Area
Average Home Value in this Area
Purchase History
| Date | Buyer | Sale Price | Title Company |
|---|---|---|---|
| Tyler Kenneth | $439,000 | Chicago Title Company | |
| De Sousa Development Inc | $164,500 | Orange Coast Title San Berna | |
| Childers Christina Fawn | -- | -- | |
| Childers Christina Fawn | $65,000 | United Title | |
| The Butler Family Living Trust | -- | -- | |
| Butler Jeri R | -- | -- |
Source: Public Records
Mortgage History
| Date | Status | Borrower | Loan Amount |
|---|---|---|---|
| Open | Tyler Kenneth | $351,200 |
Source: Public Records
Tax History
| Year | Tax Paid | Tax Assessment Tax Assessment Total Assessment is a certain percentage of the fair market value that is determined by local assessors to be the total taxable value of land and additions on the property. | Land | Improvement |
|---|---|---|---|---|
| 2025 | $7,241 | $588,141 | $100,471 | $487,670 |
| 2023 | $7,241 | $565,304 | $96,570 | $468,734 |
| 2022 | $6,780 | $535,133 | $92,020 | $443,113 |
| 2021 | $5,822 | $453,503 | $77,983 | $375,520 |
| 2020 | $5,272 | $404,914 | $69,628 | $335,286 |
| 2019 | $5,011 | $393,120 | $67,600 | $325,520 |
| 2018 | $4,875 | $378,000 | $65,000 | $313,000 |
| 2017 | $4,791 | $372,000 | $64,000 | $308,000 |
| 2016 | $4,668 | $362,000 | $62,000 | $300,000 |
| 2015 | $4,111 | $360,000 | $63,000 | $297,000 |
| 2014 | $3,814 | $291,000 | $50,000 | $241,000 |
Source: Public Records
Map
Nearby Homes
- 0 Slack Place
- 384 Sandalwood Dr
- 285 Harruby Dr
- 366 Smokeridge Trail
- 199 Summit View Dr Unit B
- 35113 Mesa Grande Dr
- 1148 Cherry Ln
- 35080 Chandler Ave Unit 39
- 35080 Chandler Ave Unit 11
- 35080 Chandler Ave Unit 92
- 366 Flordason Dr
- 66 Country Club Dr
- 371 Rogers Ct
- 323 Rogers Ln
- 35080 54 Chandler Ave
- 1002 California St
- 181 Fisher Ct
- 1265 Heritage Dr
- 9520 Calimesa Blvd
- 9443 Sharondale Rd
Your Personal Tour Guide
Ask me questions while you tour the home.