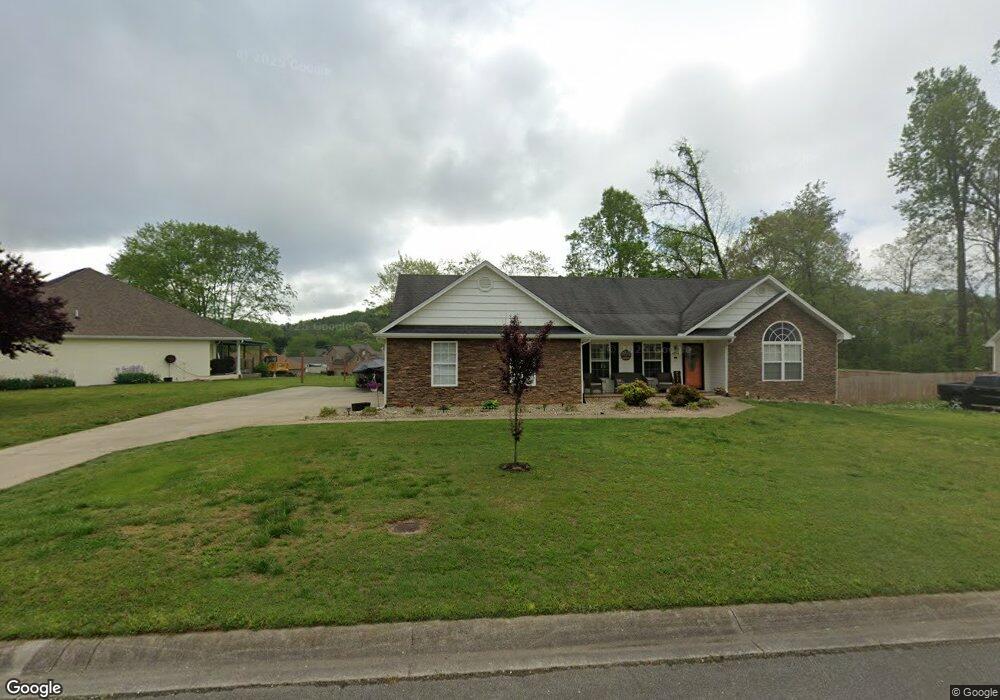
1273 Brookfield Dr Morristown, TN 37814
Estimated Value: $372,000 - $422,000
3
Beds
2
Baths
1,593
Sq Ft
$249/Sq Ft
Est. Value
About This Home
This home is located at 1273 Brookfield Dr, Morristown, TN 37814 and is currently estimated at $396,383, approximately $248 per square foot. 1273 Brookfield Dr is a home located in Hamblen County with nearby schools including Alpha Elementary School, West View Middle School, and Morristown West High School.
Ownership History
Date
Name
Owned For
Owner Type
Purchase Details
Closed on
May 13, 2019
Sold by
Hess Stevie A and Hess Hazel L
Bought by
Stout David L and Stout Cindy D
Current Estimated Value
Home Financials for this Owner
Home Financials are based on the most recent Mortgage that was taken out on this home.
Original Mortgage
$203,300
Outstanding Balance
$178,012
Interest Rate
4%
Mortgage Type
New Conventional
Estimated Equity
$218,371
Purchase Details
Closed on
Nov 20, 2012
Sold by
Rogers Construction
Bought by
Hess Stevie A and Hess Hazel L
Home Financials for this Owner
Home Financials are based on the most recent Mortgage that was taken out on this home.
Original Mortgage
$189,400
Interest Rate
3.45%
Mortgage Type
Commercial
Purchase Details
Closed on
Jun 11, 2010
Sold by
Rogers U M
Bought by
Rogers Construction
Purchase Details
Closed on
Feb 16, 1995
Bought by
Mcguffin George B and Mcguffin Rogers U
Create a Home Valuation Report for This Property
The Home Valuation Report is an in-depth analysis detailing your home's value as well as a comparison with similar homes in the area
Home Values in the Area
Average Home Value in this Area
Purchase History
| Date | Buyer | Sale Price | Title Company |
|---|---|---|---|
| Stout David L | $214,000 | None Available | |
| Hess Stevie A | $199,900 | -- | |
| Rogers Construction | $30,000 | -- | |
| Mcguffin George B | $41,847,700 | -- |
Source: Public Records
Mortgage History
| Date | Status | Borrower | Loan Amount |
|---|---|---|---|
| Open | Stout David L | $203,300 | |
| Previous Owner | Hess Stevie A | $189,400 |
Source: Public Records
Tax History Compared to Growth
Tax History
| Year | Tax Paid | Tax Assessment Tax Assessment Total Assessment is a certain percentage of the fair market value that is determined by local assessors to be the total taxable value of land and additions on the property. | Land | Improvement |
|---|---|---|---|---|
| 2024 | $954 | $54,225 | $6,700 | $47,525 |
| 2023 | $954 | $54,225 | $0 | $0 |
| 2022 | $1,713 | $54,225 | $6,700 | $47,525 |
| 2021 | $1,713 | $54,225 | $6,700 | $47,525 |
| 2020 | $1,711 | $54,225 | $6,700 | $47,525 |
| 2019 | $1,448 | $42,575 | $6,900 | $35,675 |
| 2018 | $1,341 | $42,575 | $6,900 | $35,675 |
| 2017 | $1,320 | $42,575 | $6,900 | $35,675 |
| 2016 | $1,260 | $42,575 | $6,900 | $35,675 |
| 2015 | $1,173 | $42,575 | $6,900 | $35,675 |
| 2014 | -- | $42,575 | $6,900 | $35,675 |
| 2013 | -- | $43,250 | $0 | $0 |
Source: Public Records
Map
Nearby Homes
- 5254 Rolling Springs Dr
- 1074 Hickory View Dr
- 1013 Shadow Wood Ln
- 1031 Hickory View Dr
- 1025 Hickory View Dr
- 1121 Hickory View Dr
- 1115 Millrace Rd
- 1465 Wind Crest Dr
- 1779 Seven Oaks Dr
- 4537 Horseshoe Trail
- 4562 Horseshoe Trail
- 5780 Catawba Ln
- 994 Pinewood Cir
- 665 Pinewood Cir
- 640 Pinewood Cir
- 5715 Academy Dr
- 738 Bear Springs Rd
- 1406 Dandelion Cir
- 715* Benjamin Blvd
- 4193 Scarlett Dr
- 1279 Brookfield Dr
- 1267 Brookfield Dr
- 1252 Brookfield Dr
- 1258 Brookfield Dr
- 1285 Brookfield Dr
- 1246 Brookfield Dr
- 1264 Brookfield Dr
- 5190 Crystal Brook Dr
- 5119 Hansford Place
- 5125 Hansford Place
- 1291 Brookfield Dr
- 5156 Crystal Brook Dr
- 5109 Hansford Place
- 1240 Brookfield Dr
- 1276 Brookfield Dr
- 1452 Rolling Springs Dr
- 5166 Rolling Springs Dr
- 5129 Hansford Place
- 1255 Brookfield Dr
- 5045 Hansford Place