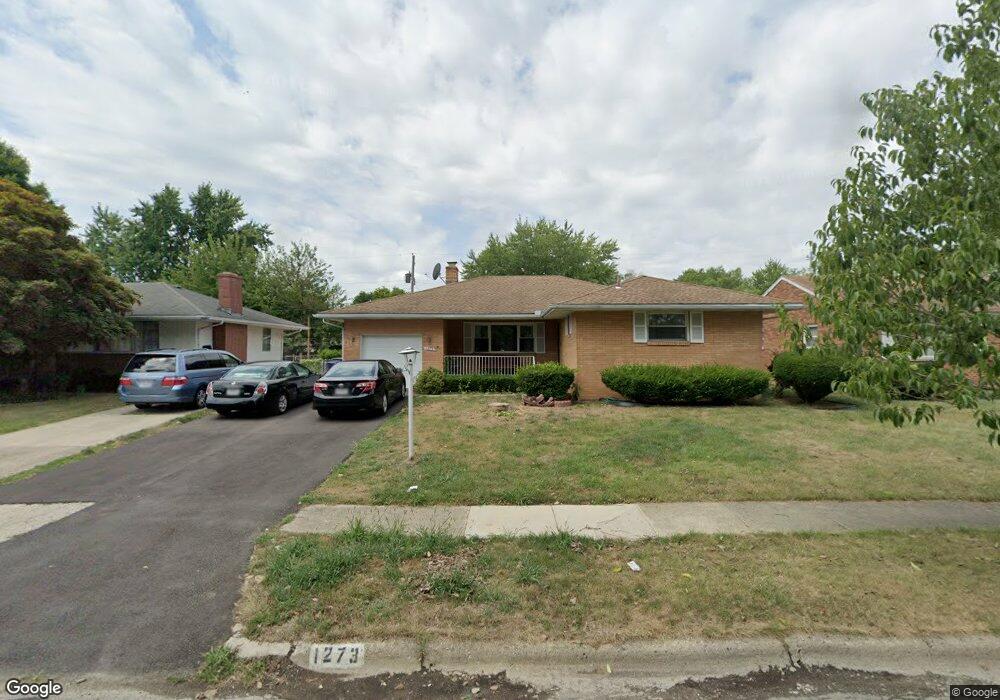
1273 Erickson Ave Columbus, OH 43227
Beechwood NeighborhoodEstimated Value: $230,000 - $293,000
4
Beds
2
Baths
1,627
Sq Ft
$160/Sq Ft
Est. Value
About This Home
This home is located at 1273 Erickson Ave, Columbus, OH 43227 and is currently estimated at $259,615, approximately $159 per square foot. 1273 Erickson Ave is a home located in Franklin County with nearby schools including Shady Lane Elementary School, Sherwood Middle School, and Walnut Ridge High School.
Ownership History
Date
Name
Owned For
Owner Type
Purchase Details
Closed on
Sep 12, 2008
Sold by
Hud
Bought by
Abebe Yohanes
Current Estimated Value
Home Financials for this Owner
Home Financials are based on the most recent Mortgage that was taken out on this home.
Original Mortgage
$68,748
Outstanding Balance
$45,486
Interest Rate
6.41%
Mortgage Type
FHA
Estimated Equity
$214,129
Purchase Details
Closed on
Nov 8, 2006
Sold by
Countrywide Home Loans Inc
Bought by
Hud
Purchase Details
Closed on
Jun 8, 2004
Sold by
Hud
Bought by
Countrywide Home Loans Inc
Purchase Details
Closed on
Jul 28, 2003
Sold by
Hickson Denise Y and Countrywide Home Loans Inc
Bought by
Hud
Purchase Details
Closed on
Jun 4, 1996
Sold by
Carfagna Pierino
Bought by
Denise Y Hickson
Home Financials for this Owner
Home Financials are based on the most recent Mortgage that was taken out on this home.
Original Mortgage
$98,188
Interest Rate
7.99%
Mortgage Type
FHA
Purchase Details
Closed on
Jan 13, 1994
Purchase Details
Closed on
Aug 13, 1991
Create a Home Valuation Report for This Property
The Home Valuation Report is an in-depth analysis detailing your home's value as well as a comparison with similar homes in the area
Home Values in the Area
Average Home Value in this Area
Purchase History
| Date | Buyer | Sale Price | Title Company |
|---|---|---|---|
| Abebe Yohanes | $69,902 | Lakeside Ti | |
| Hud | -- | Independent | |
| Countrywide Home Loans Inc | -- | Lakeside T | |
| Hud | $100,000 | Independent Title | |
| Denise Y Hickson | $98,900 | -- | |
| -- | $46,400 | -- | |
| -- | $80,000 | -- |
Source: Public Records
Mortgage History
| Date | Status | Borrower | Loan Amount |
|---|---|---|---|
| Open | Abebe Yohanes | $68,748 | |
| Previous Owner | Denise Y Hickson | $98,188 |
Source: Public Records
Tax History Compared to Growth
Tax History
| Year | Tax Paid | Tax Assessment Tax Assessment Total Assessment is a certain percentage of the fair market value that is determined by local assessors to be the total taxable value of land and additions on the property. | Land | Improvement |
|---|---|---|---|---|
| 2024 | $4,200 | $93,590 | $14,700 | $78,890 |
| 2023 | $4,147 | $93,590 | $14,700 | $78,890 |
| 2022 | $2,603 | $50,190 | $6,300 | $43,890 |
| 2021 | $2,608 | $50,190 | $6,300 | $43,890 |
| 2020 | $2,611 | $50,190 | $6,300 | $43,890 |
| 2019 | $2,440 | $40,220 | $5,040 | $35,180 |
| 2018 | $2,060 | $40,220 | $5,040 | $35,180 |
| 2017 | $2,438 | $40,220 | $5,040 | $35,180 |
| 2016 | $1,855 | $28,010 | $6,130 | $21,880 |
| 2015 | $1,684 | $28,010 | $6,130 | $21,880 |
| 2014 | $1,688 | $28,010 | $6,130 | $21,880 |
| 2013 | $1,128 | $37,940 | $6,125 | $31,815 |
Source: Public Records
Map
Nearby Homes
- 1291 Westphal Ave
- 4181 Colby Ave
- 4295 Colby Ave
- 1490 Elaine Rd Unit 1462
- 1220 Elderwood Ave
- 1294 Dellwood Ave
- 4363 E Mound St
- 3945 Dillon Dr
- 3955 E Fulton St
- 1281 Maetzel Dr
- 1543 S Hamilton Rd
- 1635 Elaine Rd
- 4467 Grimsby Rd
- 963 Erickson Ave
- 4484 Grimsby Rd
- 4501 Amesbury Rd
- 1640 Striebel Rd
- 4530 Amesbury Rd
- 4144 Mcallister Ave
- 1068 Ross Rd
- 1273 Erickson Rd
- 1281 Erickson Rd
- 1265 Erickson Rd
- 1289 Erickson Rd
- 1268 Elaine Rd
- 1257 Erickson Rd
- 1276 Elaine Rd
- 1260 Elaine Rd
- 1268 Erickson Ave
- 1284 Elaine Rd
- 1276 Erickson Rd
- 1252 Elaine Rd
- 1284 Erickson Rd
- 1297 Erickson Rd
- 1268 Erickson Rd
- 1249 Erickson Rd
- 1292 Erickson Rd
- 1260 Erickson Rd
- 1292 Elaine Rd
- 1244 Elaine Rd