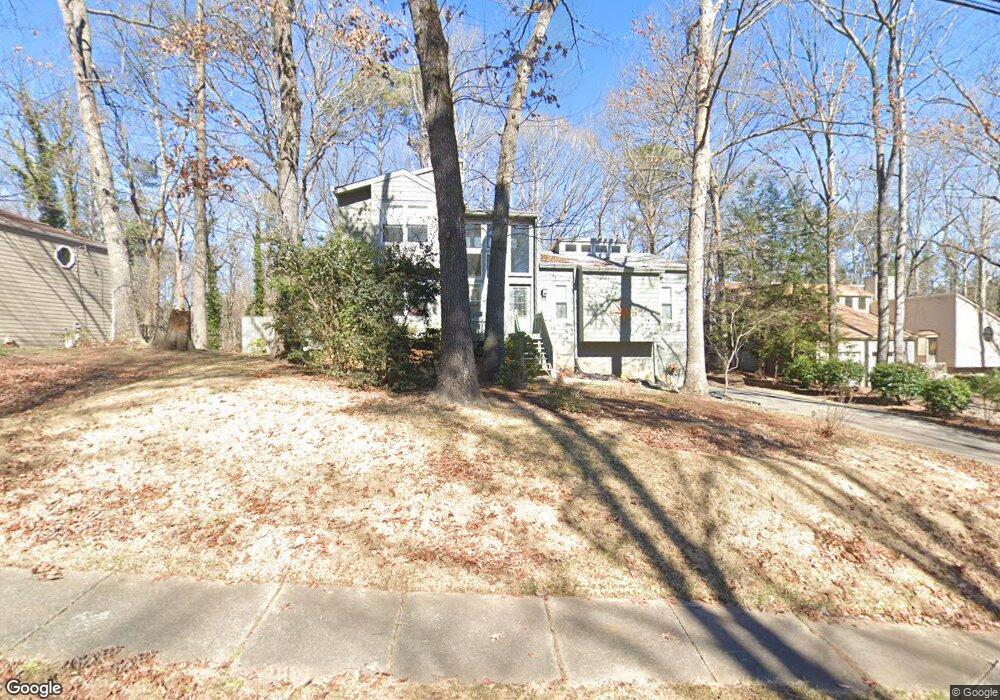
1273 Laurel Cliff Dr SE Smyrna, GA 30082
Estimated Value: $431,710 - $515,000
3
Beds
3
Baths
1,897
Sq Ft
$241/Sq Ft
Est. Value
About This Home
This home is located at 1273 Laurel Cliff Dr SE, Smyrna, GA 30082 and is currently estimated at $457,428, approximately $241 per square foot. 1273 Laurel Cliff Dr SE is a home located in Cobb County with nearby schools including Nickajack Elementary School, Griffin Middle School, and Campbell High School.
Ownership History
Date
Name
Owned For
Owner Type
Purchase Details
Closed on
Nov 1, 2011
Sold by
Abel Mitchell Lee
Bought by
Nichols Diana S
Current Estimated Value
Purchase Details
Closed on
Jan 1, 2011
Sold by
Nichols Diana S
Bought by
Abel Mitchell L
Purchase Details
Closed on
Jul 1, 2010
Sold by
Abel Mitchell L
Bought by
Abel Mitchell L and Nichols Diana
Home Financials for this Owner
Home Financials are based on the most recent Mortgage that was taken out on this home.
Original Mortgage
$114,000
Interest Rate
4.6%
Mortgage Type
New Conventional
Purchase Details
Closed on
Feb 27, 1998
Sold by
Faith Mark S and Faith Niki S
Bought by
Abel Mitchell L
Home Financials for this Owner
Home Financials are based on the most recent Mortgage that was taken out on this home.
Original Mortgage
$123,200
Interest Rate
6.86%
Mortgage Type
New Conventional
Create a Home Valuation Report for This Property
The Home Valuation Report is an in-depth analysis detailing your home's value as well as a comparison with similar homes in the area
Home Values in the Area
Average Home Value in this Area
Purchase History
| Date | Buyer | Sale Price | Title Company |
|---|---|---|---|
| Nichols Diana S | -- | -- | |
| Abel Mitchell L | -- | -- | |
| Abel Mitchell L | -- | -- | |
| Abel Mitchell L | -- | -- |
Source: Public Records
Mortgage History
| Date | Status | Borrower | Loan Amount |
|---|---|---|---|
| Previous Owner | Abel Mitchell L | $114,000 | |
| Previous Owner | Abel Mitchell L | $123,200 |
Source: Public Records
Tax History Compared to Growth
Tax History
| Year | Tax Paid | Tax Assessment Tax Assessment Total Assessment is a certain percentage of the fair market value that is determined by local assessors to be the total taxable value of land and additions on the property. | Land | Improvement |
|---|---|---|---|---|
| 2025 | $997 | $198,064 | $62,000 | $136,064 |
| 2024 | $899 | $164,004 | $54,000 | $110,004 |
| 2023 | $693 | $164,004 | $54,000 | $110,004 |
| 2022 | $818 | $136,936 | $34,000 | $102,936 |
| 2021 | $760 | $117,392 | $34,000 | $83,392 |
| 2020 | $719 | $103,668 | $34,000 | $69,668 |
| 2019 | $719 | $103,668 | $34,000 | $69,668 |
| 2018 | $681 | $91,016 | $34,000 | $57,016 |
| 2017 | $552 | $73,064 | $28,000 | $45,064 |
| 2016 | $555 | $73,064 | $28,000 | $45,064 |
| 2015 | $559 | $62,472 | $16,000 | $46,472 |
| 2014 | $571 | $62,472 | $0 | $0 |
Source: Public Records
Map
Nearby Homes
- 2158 Berryhill Cir SE
- 2163 Berryhill Cir SE
- 4381 King Valley Dr SE
- 4368 Laurel Cir SE
- 4398 King Valley 3-5 Dr SE
- 5033 David Place SE
- 204 Kenninghall Ln SE Unit 6
- 1554 Cooper Lake Rd SE
- 1181 Parkland Run SE
- 904 Bridge Ln SE
- 951 Reed Rd SE
- 505 Bridge Ln SE
- 502 Bridge Ln SE
- 1212 Stone Castle Cir SE
- 1224 Kenway Cir SE
- 4201 Charleston Trail SE
- 5188 Laurel Bridge Ct SE
- 1222 Creekside Place SE
- 606 Mill Pond Dr SE
- 609 Mill Pond Dr SE
- 1261 Laurel Cliff Dr SE
- 1285 Laurel Cliff Dr SE
- 1249 Laurel Cliff Dr SE
- 1297 Laurel Cliff Dr SE
- 1266 Laurel Cliff Dr SE
- 1278 Laurel Cliff Dr SE
- 1300 Laurel Cliff Dr SE
- 1250 Laurel Cliff Dr SE
- 1309 Laurel Cliff Dr SE
- 1237 Laurel Cliff Dr SE
- 1238 Laurel Cliff Dr SE
- 0 Laurel Cliff Dr SE Unit 8731310
- 0 Laurel Cliff Dr SE Unit 8671192
- 0 Laurel Cliff Dr SE Unit 8186739
- 0 Laurel Cliff Dr SE
- 1321 Laurel Cliff Dr SE
- 1225 Laurel Cliff Dr SE
- 4244 Laurel Brook Dr SE
- 1222 Laurel Cliff Dr SE
- 4252 Laurel Brook Dr SE