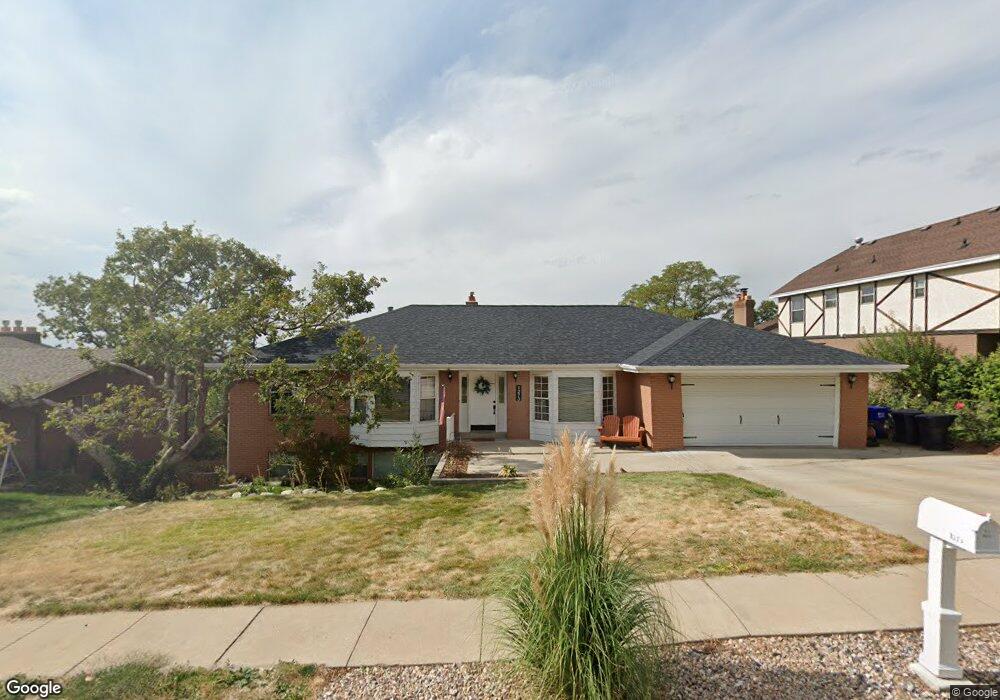
1273 N 400 E Centerville, UT 84014
Estimated Value: $656,000 - $824,000
--
Bed
5
Baths
1,872
Sq Ft
$400/Sq Ft
Est. Value
About This Home
This home is located at 1273 N 400 E, Centerville, UT 84014 and is currently estimated at $749,173, approximately $400 per square foot. 1273 N 400 E is a home located in Davis County with nearby schools including Stewart Elementary School, Centerville Jr High, and Viewmont High School.
Ownership History
Date
Name
Owned For
Owner Type
Purchase Details
Closed on
Dec 30, 2019
Sold by
Morgan James R
Bought by
Hyde Bradley A and Hyde Mandy L
Current Estimated Value
Home Financials for this Owner
Home Financials are based on the most recent Mortgage that was taken out on this home.
Original Mortgage
$388,000
Outstanding Balance
$342,078
Interest Rate
3.6%
Mortgage Type
New Conventional
Estimated Equity
$407,095
Purchase Details
Closed on
Sep 3, 1997
Sold by
Morgan James R and Morgan Susan H
Bought by
Morgan James R
Create a Home Valuation Report for This Property
The Home Valuation Report is an in-depth analysis detailing your home's value as well as a comparison with similar homes in the area
Purchase History
| Date | Buyer | Sale Price | Title Company |
|---|---|---|---|
| Hyde Bradley A | -- | Rudd & Hawkes Ttl Ins Agcy L | |
| Morgan James R | -- | -- |
Source: Public Records
Mortgage History
| Date | Status | Borrower | Loan Amount |
|---|---|---|---|
| Open | Hyde Bradley A | $388,000 |
Source: Public Records
Tax History
| Year | Tax Paid | Tax Assessment Tax Assessment Total Assessment is a certain percentage of the fair market value that is determined by local assessors to be the total taxable value of land and additions on the property. | Land | Improvement |
|---|---|---|---|---|
| 2025 | $3,944 | $377,300 | $179,488 | $197,812 |
| 2024 | $3,929 | $382,250 | $163,283 | $218,967 |
| 2023 | $4,058 | $689,000 | $265,268 | $423,732 |
| 2022 | $4,096 | $396,550 | $134,468 | $262,082 |
| 2021 | $3,614 | $545,000 | $208,121 | $336,879 |
| 2020 | $3,098 | $467,000 | $201,836 | $265,164 |
| 2019 | $2,839 | $418,000 | $197,542 | $220,458 |
| 2018 | $2,674 | $389,000 | $183,041 | $205,959 |
| 2016 | $2,313 | $187,000 | $64,119 | $122,881 |
| 2015 | $2,344 | $178,750 | $64,119 | $114,631 |
| 2014 | $1,997 | $155,797 | $64,016 | $91,781 |
| 2013 | -- | $161,226 | $49,000 | $112,226 |
Source: Public Records
Map
Nearby Homes
- 1290 Oakridge Dr
- 1366 Cottonwood Dr
- 984 N 500 E
- 145 Ford Canyon Dr
- 243 Balsam Dr
- 66 Brookside Ln
- 775 Pheasantbrook Cir
- 290 W 1350 N
- 271 Brookfield Ln
- 563 N 220 E
- 371 W 1125 N
- 1238 N 450 W
- 781 Pheasantbrook Dr
- 292 W 680 N
- 380 E 400 N
- 281 W 650 N Unit B
- 282 W 605 N Unit A
- 282 W 605 N Unit I
- 303 W 650 N Unit I
- 1549 N 400 W
Your Personal Tour Guide
Ask me questions while you tour the home.