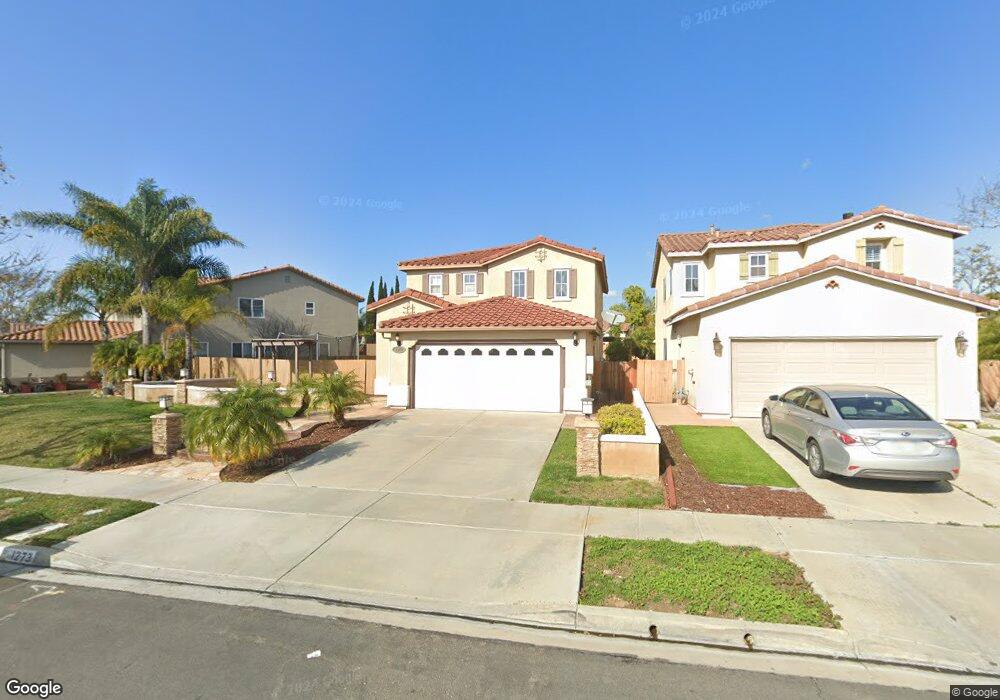
1273 Seagreen Place Unit 7B San Diego, CA 92154
Ocean View Hills NeighborhoodEstimated Value: $907,000 - $977,000
4
Beds
3
Baths
2,092
Sq Ft
$445/Sq Ft
Est. Value
About This Home
This home is located at 1273 Seagreen Place Unit 7B, San Diego, CA 92154 and is currently estimated at $931,269, approximately $445 per square foot. 1273 Seagreen Place Unit 7B is a home located in San Diego County with nearby schools including Ocean View Hills, Vista Del Mar, and San Ysidro Middle School.
Ownership History
Date
Name
Owned For
Owner Type
Purchase Details
Closed on
Mar 31, 2015
Sold by
Osmon Homes Llc
Bought by
Rangel Conrad and Olivas Diana Janet Navarro
Current Estimated Value
Home Financials for this Owner
Home Financials are based on the most recent Mortgage that was taken out on this home.
Original Mortgage
$390,000
Outstanding Balance
$299,134
Interest Rate
3.64%
Mortgage Type
New Conventional
Estimated Equity
$632,135
Purchase Details
Closed on
Feb 18, 2015
Sold by
Calaycay Ferdinand E and Calaycay Maria Luz
Bought by
Osmon Homes Llc
Home Financials for this Owner
Home Financials are based on the most recent Mortgage that was taken out on this home.
Original Mortgage
$390,000
Outstanding Balance
$299,134
Interest Rate
3.64%
Mortgage Type
New Conventional
Estimated Equity
$632,135
Purchase Details
Closed on
Apr 25, 2003
Sold by
Pardee Homes
Bought by
Calaycay Ferdinand E and Calaycay Maria Luz
Home Financials for this Owner
Home Financials are based on the most recent Mortgage that was taken out on this home.
Original Mortgage
$310,100
Interest Rate
6.12%
Mortgage Type
Purchase Money Mortgage
Create a Home Valuation Report for This Property
The Home Valuation Report is an in-depth analysis detailing your home's value as well as a comparison with similar homes in the area
Home Values in the Area
Average Home Value in this Area
Purchase History
| Date | Buyer | Sale Price | Title Company |
|---|---|---|---|
| Rangel Conrad | $490,000 | Title 365 | |
| Osmon Homes Llc | $380,000 | Title 365 | |
| Calaycay Ferdinand E | $388,000 | Chicago Title Co |
Source: Public Records
Mortgage History
| Date | Status | Borrower | Loan Amount |
|---|---|---|---|
| Open | Rangel Conrad | $390,000 | |
| Previous Owner | Calaycay Ferdinand E | $310,100 | |
| Closed | Calaycay Ferdinand E | $77,530 |
Source: Public Records
Tax History Compared to Growth
Tax History
| Year | Tax Paid | Tax Assessment Tax Assessment Total Assessment is a certain percentage of the fair market value that is determined by local assessors to be the total taxable value of land and additions on the property. | Land | Improvement |
|---|---|---|---|---|
| 2025 | $8,613 | $588,897 | $240,367 | $348,530 |
| 2024 | $8,613 | $577,351 | $235,654 | $341,697 |
| 2023 | $8,438 | $566,032 | $231,034 | $334,998 |
| 2022 | $8,093 | $554,934 | $226,504 | $328,430 |
| 2021 | $8,104 | $544,054 | $222,063 | $321,991 |
| 2020 | $7,967 | $538,477 | $219,787 | $318,690 |
| 2019 | $7,635 | $527,920 | $215,478 | $312,442 |
| 2018 | $7,502 | $517,569 | $211,253 | $306,316 |
| 2017 | $81 | $507,421 | $207,111 | $300,310 |
| 2016 | $7,152 | $497,472 | $203,050 | $294,422 |
| 2015 | $6,466 | $430,000 | $141,000 | $289,000 |
| 2014 | $6,006 | $390,000 | $128,000 | $262,000 |
Source: Public Records
Map
Nearby Homes
- 1233 Sandy Cape Ct
- 5211 Calle Rockfish Unit 90
- 1251 Paseo Sea Breeze Unit 14
- 1251 Paseo Sea Breeze Unit 17
- 1320 Calle Sandcliff Unit 41
- 5140 Calle Sand Arch Unit 61
- 5405 Calle Sand Arch Unit 197
- 5360 Calle Rockfish Unit 32
- 5402 Sand Arch Ln Unit 199
- 1210 Jade Cove Ct
- 5208 Surfwalk Way Unit 153
- 1270 Paseo Sea Breeze Unit 26
- 5317 Westport View Dr
- 5265 Beachfront Cove Unit 167
- 5261 Beachfront Cove Unit 175
- 1250 Sand Drift Point
- 5280 Beachfront Cove Unit 239
- 5240 Beachfront Cove Unit 89
- 5305 Seacliff Place
- 5305 Seacliff Place Unit 5
- 1263 Seagreen Place Unit 7B
- 1277 Seagreen Place Unit 7B
- 1246 Beryl Cove Point
- 1253 Seagreen Place Unit 7B
- 1242 Beryl Cove Point Unit 7B
- 1247 Seagreen Place Unit 7B
- 1276 Seagreen Place
- 1272 Seagreen Place
- 1243 Seagreen Place Unit 7B
- 1255 Beryl Cove Point
- 1268 Seagreen Place
- 1259 Beryl Cove Point
- 1264 Seagreen Place Unit 7B
- 1251 Beryl Cove Point
- 1263 Beryl Cove Point Unit 7B
- 1260 Seagreen Place
- 1247 Beryl Cove Point Unit 7B
- 5339 Seaglen Way
- 5343 Seaglen Way
- 5335 Seaglen Way