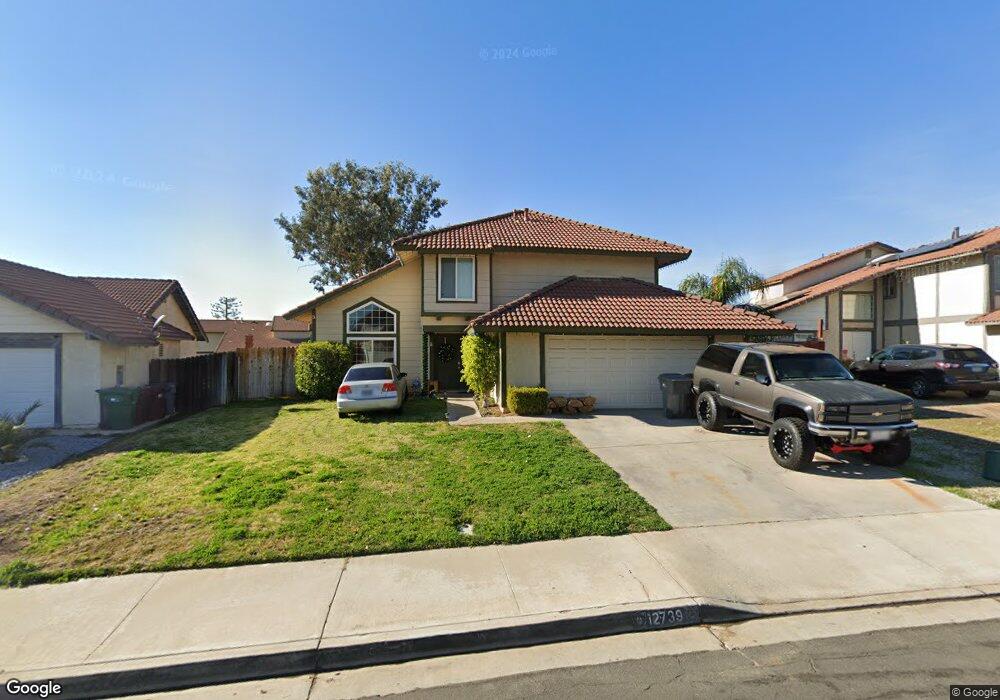
12739 Ninebark St Moreno Valley, CA 92553
Bear Valley NeighborhoodEstimated Value: $524,371 - $589,000
3
Beds
3
Baths
1,796
Sq Ft
$315/Sq Ft
Est. Value
About This Home
This home is located at 12739 Ninebark St, Moreno Valley, CA 92553 and is currently estimated at $566,343, approximately $315 per square foot. 12739 Ninebark St is a home located in Riverside County with nearby schools including Bear Valley Elementary School, Mountain View Middle, and Valley View High School.
Ownership History
Date
Name
Owned For
Owner Type
Purchase Details
Closed on
Feb 25, 2020
Sold by
2017 1 Ih Borrower Lp
Bought by
Thr California Lp
Current Estimated Value
Purchase Details
Closed on
Nov 19, 2013
Sold by
The California Lp
Bought by
2013 1 Ih Borrower Lp
Home Financials for this Owner
Home Financials are based on the most recent Mortgage that was taken out on this home.
Original Mortgage
$479,137,000
Interest Rate
4.04%
Mortgage Type
Purchase Money Mortgage
Purchase Details
Closed on
Apr 19, 2012
Sold by
Clark Deanna D
Bought by
Thr California Llc
Purchase Details
Closed on
Apr 28, 1999
Sold by
Sec Va
Bought by
Clark Deanna D
Home Financials for this Owner
Home Financials are based on the most recent Mortgage that was taken out on this home.
Original Mortgage
$106,125
Interest Rate
7.01%
Mortgage Type
FHA
Purchase Details
Closed on
Jun 19, 1998
Sold by
Fleet Mtg Corp
Bought by
Va
Purchase Details
Closed on
Jun 18, 1998
Sold by
Bell Roland Duncan and Bell Rebecca Louise
Bought by
Fleet Mtg Corp and Fleet Real Estate Funding
Create a Home Valuation Report for This Property
The Home Valuation Report is an in-depth analysis detailing your home's value as well as a comparison with similar homes in the area
Home Values in the Area
Average Home Value in this Area
Purchase History
| Date | Buyer | Sale Price | Title Company |
|---|---|---|---|
| Thr California Lp | -- | Os National Llc | |
| 2013 1 Ih Borrower Lp | -- | None Available | |
| Thr California Llc | $141,700 | Chicago Title Company | |
| Clark Deanna D | $107,000 | First American Title Co | |
| Va | -- | First Southwestern Title Co | |
| Fleet Mtg Corp | $90,332 | First Southwestern Title Co |
Source: Public Records
Mortgage History
| Date | Status | Borrower | Loan Amount |
|---|---|---|---|
| Previous Owner | 2013 1 Ih Borrower Lp | $479,137,000 | |
| Previous Owner | Clark Deanna D | $106,125 |
Source: Public Records
Tax History Compared to Growth
Tax History
| Year | Tax Paid | Tax Assessment Tax Assessment Total Assessment is a certain percentage of the fair market value that is determined by local assessors to be the total taxable value of land and additions on the property. | Land | Improvement |
|---|---|---|---|---|
| 2025 | $4,429 | $390,427 | $97,333 | $293,094 |
| 2023 | $4,429 | $375,268 | $93,554 | $281,714 |
| 2022 | $4,259 | $367,911 | $91,720 | $276,191 |
| 2021 | $4,179 | $360,698 | $89,922 | $270,776 |
| 2020 | $3,573 | $306,688 | $58,366 | $248,322 |
| 2019 | $3,514 | $300,675 | $57,222 | $243,453 |
| 2018 | $3,757 | $294,780 | $56,100 | $238,680 |
| 2017 | $1,862 | $153,676 | $32,465 | $121,211 |
| 2016 | $1,844 | $150,664 | $31,829 | $118,835 |
| 2015 | $1,819 | $148,401 | $31,351 | $117,050 |
| 2014 | $1,697 | $178,000 | $40,000 | $138,000 |
Source: Public Records
Map
Nearby Homes
- 12685 Kitching St
- 12919 Orleans Dr
- 13060 Pawnee Dr
- 24384 Fir Ave
- 24320 Fir Ave
- 25650 Onate Dr
- 12975 Tamara Dr
- 25626 Vespucci Ave
- 26500 Coconut Ln
- 25639 Palm Shadows Dr
- 26537 Azalea St
- 12623 Torrey Pine Rd
- 12830 Perris Blvd Unit C10
- 25212 Hemlock Ave
- 25057 Eucalyptus Ave
- 25646 Javier Place
- 11855 Rockingham St
- 26219 Dardanelle Ct
- Plan 2862 at Palmetto
- Plan 1542 at Palmetto
- 12729 Ninebark St
- 12747 Ninebark St
- 12721 Ninebark St
- 25834 Fir Ave
- 25833 Sweetleaf St
- 25888 Fir Ave
- 12711 Ninebark St
- 25821 Sweetleaf St
- 12767 Ninebark St
- 25822 Fir Ave
- 12748 Hackberry Ln
- 25846 Sweetleaf St
- 25902 Fir Ave
- 12701 Ninebark St
- 12758 Velvetleaf St
- 25810 Fir Ave
- 12779 Ninebark St
- 25889 Fir Ave
- 12738 Hackberry Ln
- 25809 Sweetleaf St