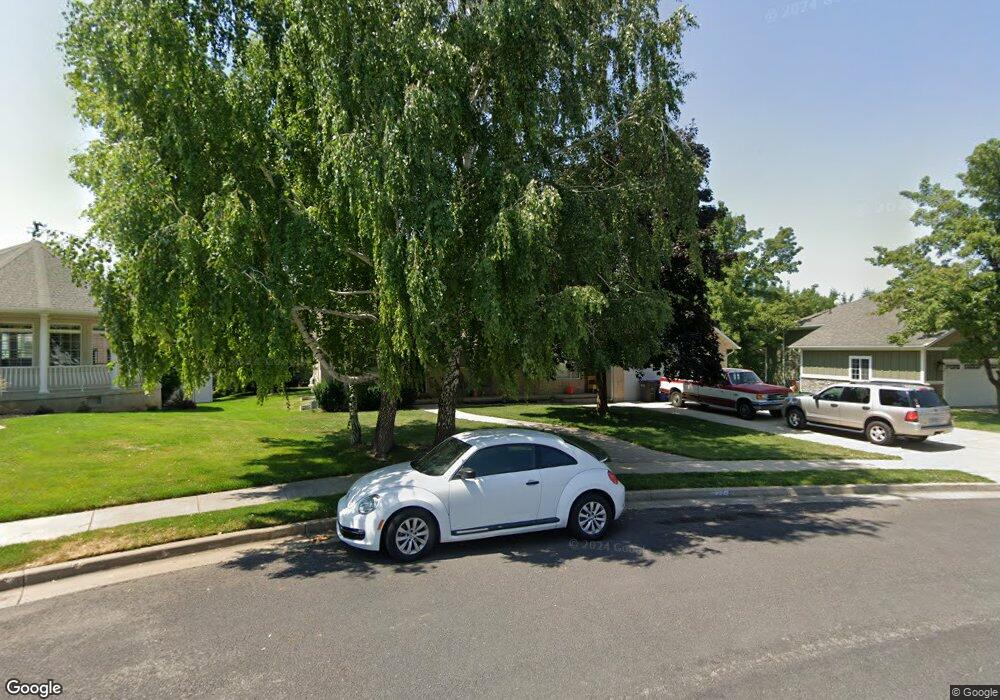
1274 Orchard Heights Logan, UT 84321
Wilson NeighborhoodEstimated Value: $524,000 - $621,000
4
Beds
4
Baths
3,022
Sq Ft
$190/Sq Ft
Est. Value
About This Home
This home is located at 1274 Orchard Heights, Logan, UT 84321 and is currently estimated at $575,239, approximately $190 per square foot. 1274 Orchard Heights is a home located in Cache County with nearby schools including Wilson School, Mount Logan Middle School, and Logan High School.
Ownership History
Date
Name
Owned For
Owner Type
Purchase Details
Closed on
Oct 7, 2023
Sold by
Mazzola Sam
Bought by
Jensen Landon S and Jensen Jamie R
Current Estimated Value
Purchase Details
Closed on
Mar 12, 2021
Sold by
Mazzola Sam
Bought by
Mazzola Sam
Home Financials for this Owner
Home Financials are based on the most recent Mortgage that was taken out on this home.
Original Mortgage
$136,700
Interest Rate
2.7%
Mortgage Type
New Conventional
Purchase Details
Closed on
Jan 4, 2021
Sold by
Meservy Nile Dean and Meservy Shaura A
Bought by
Mazzola Sam
Purchase Details
Closed on
Aug 27, 2010
Sold by
Nelson Anna Louise
Bought by
Meservy Nile Dean and Meservy Shaura A
Home Financials for this Owner
Home Financials are based on the most recent Mortgage that was taken out on this home.
Original Mortgage
$198,000
Interest Rate
4.45%
Mortgage Type
New Conventional
Purchase Details
Closed on
Oct 24, 2001
Sold by
Holbrook W Reed and Holbrook Teresa K
Bought by
Holbrook W Reed and Holbrook Teresa K
Create a Home Valuation Report for This Property
The Home Valuation Report is an in-depth analysis detailing your home's value as well as a comparison with similar homes in the area
Home Values in the Area
Average Home Value in this Area
Purchase History
| Date | Buyer | Sale Price | Title Company |
|---|---|---|---|
| Jensen Landon S | -- | Advanced Title | |
| Jensen Landon S | -- | Advanced Title | |
| Mazzola Sam | -- | Pinnacle Title | |
| Mazzola Sam | -- | Pinnacle Title | |
| Mazzola Sam | -- | Cache Title Logan | |
| Mazzola Sam | -- | None Listed On Document | |
| Meservy Nile Dean | -- | Lincoln Title Ins Agency | |
| Holbrook W Reed | -- | -- |
Source: Public Records
Mortgage History
| Date | Status | Borrower | Loan Amount |
|---|---|---|---|
| Previous Owner | Mazzola Sam | $136,700 | |
| Previous Owner | Meservy Nile Dean | $198,000 |
Source: Public Records
Tax History Compared to Growth
Tax History
| Year | Tax Paid | Tax Assessment Tax Assessment Total Assessment is a certain percentage of the fair market value that is determined by local assessors to be the total taxable value of land and additions on the property. | Land | Improvement |
|---|---|---|---|---|
| 2025 | $2,098 | $271,315 | $0 | $0 |
| 2024 | $215 | $269,685 | $0 | $0 |
| 2023 | $2,239 | $267,350 | $0 | $0 |
| 2022 | $2,398 | $267,350 | $0 | $0 |
| 2021 | $2,353 | $405,375 | $82,500 | $322,875 |
| 2020 | $2,353 | $364,848 | $82,500 | $282,348 |
| 2019 | $2,460 | $364,848 | $82,500 | $282,348 |
| 2018 | $2,276 | $308,220 | $62,700 | $245,520 |
| 2017 | $2,196 | $157,245 | $0 | $0 |
| 2016 | $2,277 | $157,245 | $0 | $0 |
| 2015 | $1,794 | $123,785 | $0 | $0 |
| 2014 | $1,622 | $123,785 | $0 | $0 |
| 2013 | -- | $125,435 | $0 | $0 |
Source: Public Records
Map
Nearby Homes
- 1383 Mount Logan Loop
- 1279 Eastridge Dr
- 128 S 1170 E
- 357 Paintbrush Ln
- 10 S 1300 E
- 1605 Mountain Rd
- 1034 Thrushwood Dr
- 147 Winding Way Unit 50
- 159 Winding Way Unit 49
- 1374 E 260 N
- 556 N 520 E
- 1387 E 260 N
- 28 River Pointe Dr
- 720 E 525 N Unit 32
- Cedar Ridge Plan at Shoreline Estates
- Strata Plan at Shoreline Estates
- Hamilton Plan at Shoreline Estates
- Manhattan Plan at Shoreline Estates
- Huntington Plan at Shoreline Estates
- Viewside Plan at Shoreline Estates
- 1274 Orchard Heights Dr
- 1282 Orchard Heights
- 1264 Orchard Heights
- 212 Eastridge Ln
- 206 Eastridge Ln
- 224 Eastridge Ln
- 1283 Orchard Heights
- 1288 Orchard Heights
- 236 Eastridge Ln
- 1279 Orchard Heights
- 1257 Orchard Heights
- 196 Eastridge Ln
- 1292 Orchard Heights Dr
- 211 Eastridge Ln Unit 8
- 1292 Orchard Heights
- 1289 Orchard Heights
- 243 Eastridge Ln
- 205 Eastridge Ln
- 1271 Orchard Heights
- 242 Eastridge Ln