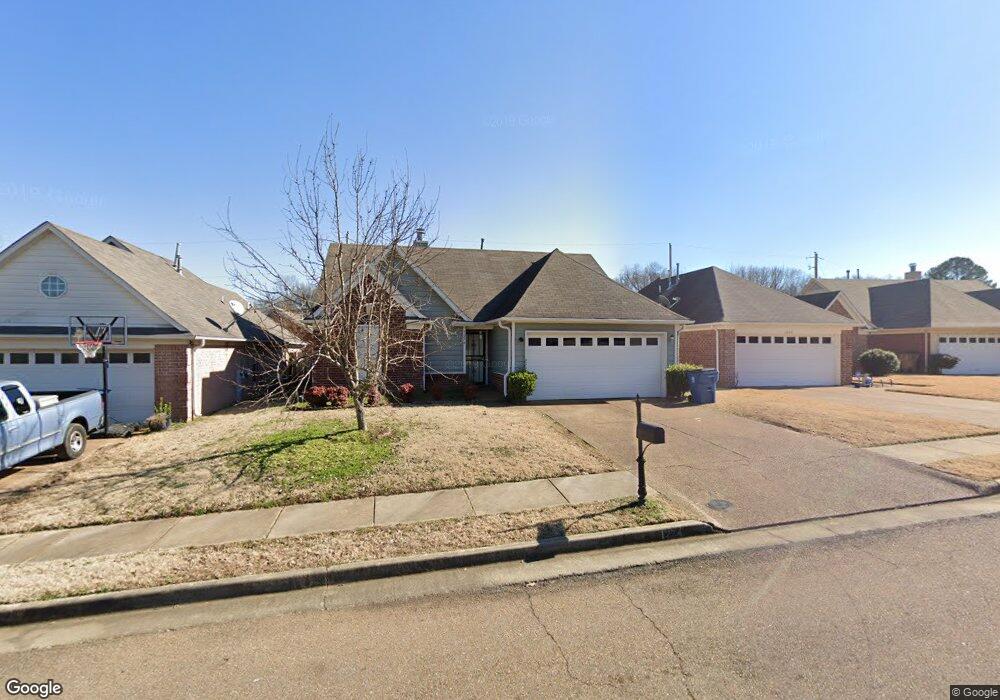
1274 Wilpat Dr Cordova, TN 38018
Cordova NeighborhoodEstimated Value: $229,000 - $243,000
3
Beds
2
Baths
1,417
Sq Ft
$165/Sq Ft
Est. Value
About This Home
This home is located at 1274 Wilpat Dr, Cordova, TN 38018 and is currently estimated at $234,421, approximately $165 per square foot. 1274 Wilpat Dr is a home located in Shelby County with nearby schools including Dexter Elementary School, Dexter Middle School, and Cordova High School.
Ownership History
Date
Name
Owned For
Owner Type
Purchase Details
Closed on
Feb 25, 2013
Sold by
Brooks Leonard M and Brooks Estelle
Bought by
Brooks L B and Brooks Brenda
Current Estimated Value
Purchase Details
Closed on
Nov 30, 2006
Sold by
Maurizi Cynthia L Lott
Bought by
Dong Jian Cai
Home Financials for this Owner
Home Financials are based on the most recent Mortgage that was taken out on this home.
Original Mortgage
$118,085
Interest Rate
6.36%
Mortgage Type
Purchase Money Mortgage
Purchase Details
Closed on
Jun 15, 2001
Sold by
Sovereign Homes Llc
Bought by
Lott Cynthia L
Home Financials for this Owner
Home Financials are based on the most recent Mortgage that was taken out on this home.
Original Mortgage
$130,945
Interest Rate
7.06%
Mortgage Type
FHA
Create a Home Valuation Report for This Property
The Home Valuation Report is an in-depth analysis detailing your home's value as well as a comparison with similar homes in the area
Home Values in the Area
Average Home Value in this Area
Purchase History
| Date | Buyer | Sale Price | Title Company |
|---|---|---|---|
| Brooks L B | -- | None Available | |
| Dong Jian Cai | $124,300 | Realty Title & Escrow | |
| Lott Cynthia L | $133,000 | Southern Escrow Title Compan | |
| Lott Cynthia L | $133,000 | Southern Escrow Title Compan |
Source: Public Records
Mortgage History
| Date | Status | Borrower | Loan Amount |
|---|---|---|---|
| Previous Owner | Dong Jian Cai | $118,085 | |
| Previous Owner | Lott Cynthia L | $130,945 |
Source: Public Records
Tax History Compared to Growth
Tax History
| Year | Tax Paid | Tax Assessment Tax Assessment Total Assessment is a certain percentage of the fair market value that is determined by local assessors to be the total taxable value of land and additions on the property. | Land | Improvement |
|---|---|---|---|---|
| 2025 | $1,337 | $62,450 | $8,750 | $53,700 |
| 2024 | $1,337 | $39,425 | $6,875 | $32,550 |
| 2023 | $1,337 | $39,425 | $6,875 | $32,550 |
| 2022 | $1,337 | $39,425 | $6,875 | $32,550 |
| 2021 | $1,360 | $39,425 | $6,875 | $32,550 |
| 2020 | $1,187 | $29,300 | $6,875 | $22,425 |
| 2019 | $1,187 | $29,300 | $6,875 | $22,425 |
| 2018 | $1,187 | $29,300 | $6,875 | $22,425 |
| 2017 | $1,204 | $29,300 | $6,875 | $22,425 |
| 2016 | $1,191 | $27,250 | $0 | $0 |
| 2014 | $1,191 | $27,250 | $0 | $0 |
Source: Public Records
Map
Nearby Homes
- 7194 Charlton Way
- 1321 Winter Springs Ln
- 7412 Lost Trail Dr
- 7520 Crystal Lake Dr
- 7426 Lost Trail Dr
- 1089 Links View Ln W
- 1382 Exbury Dr
- 1277 Winter Springs Ln
- 7410 Appling Rain Dr
- 7407 Lost Grove Ln
- 7468 Links View Ln S
- 7494 Links View Ln S
- 7035 S Estacada Way
- 1520 Cider House Ln
- 1595 Dexter Grove Ct Unit E105
- 1595 Dexter Grove Ct Unit D101
- 6916 Lagrange Pines Rd
- 7646 Dexter Run Cir
- 1102 Mirror Lake Ln
- 7247 Winterbrook Ln
- 1268 Wilpat Dr
- 1262 Wilpat Dr
- 1286 Wilpat Dr
- 1269 Bridgewater Rd
- 1263 Bridgewater Rd
- 1273 Bridgewater Rd
- 7272 Bridgefield Dr
- 1257 Bridgewater Rd
- 1277 Bridgewater Rd
- 7285 Bridgefield Dr
- 1292 Wilpat Dr
- 1281 Wilpat Dr
- 7279 Bridgefield Dr
- 1251 Bridgewater Rd
- 7266 Bridgefield Dr
- 7273 Bridgefield Dr
- 1287 Wilpat Dr
- 1283 Bridgewater Rd
- 1245 Bridgewater Rd
- 7267 Bridgefield Dr