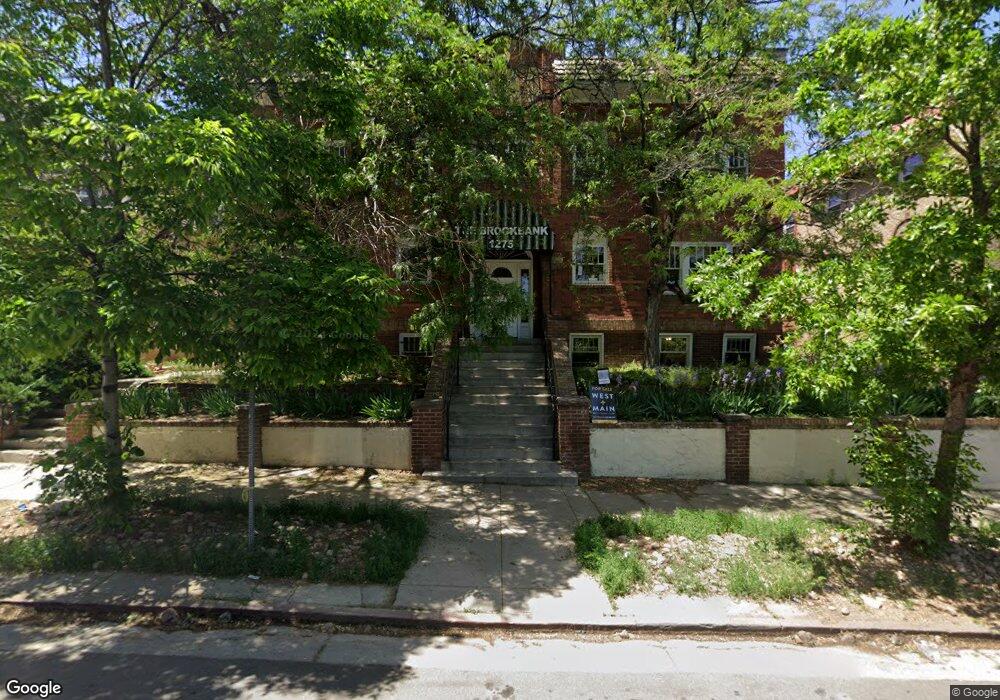
1275 Clarkson St Unit 6 Denver, CO 80218
Capitol Hill NeighborhoodEstimated Value: $209,000 - $235,234
1
Bed
1
Bath
721
Sq Ft
$302/Sq Ft
Est. Value
About This Home
This home is located at 1275 Clarkson St Unit 6, Denver, CO 80218 and is currently estimated at $218,059, approximately $302 per square foot. 1275 Clarkson St Unit 6 is a home located in Denver County with nearby schools including Dora Moore ECE-8 School, Morey Middle School, and East High School.
Ownership History
Date
Name
Owned For
Owner Type
Purchase Details
Closed on
Jan 3, 2025
Sold by
Miller Ken
Bought by
Dorman Cody and Godfrey Austin
Current Estimated Value
Home Financials for this Owner
Home Financials are based on the most recent Mortgage that was taken out on this home.
Original Mortgage
$204,670
Outstanding Balance
$203,257
Interest Rate
6.84%
Mortgage Type
New Conventional
Estimated Equity
$14,802
Purchase Details
Closed on
May 6, 2021
Sold by
Wong Patrick Kin Fai
Bought by
Miller Ken
Purchase Details
Closed on
Apr 14, 1995
Sold by
Phillips Greg F
Bought by
Wong Patrick Kin Fai
Purchase Details
Closed on
Mar 8, 1995
Sold by
Garbs Elinor I
Bought by
Garbs David N
Purchase Details
Closed on
Feb 12, 1994
Sold by
Jerome Glenn R
Bought by
Phillips Greg F
Purchase Details
Closed on
Nov 11, 1993
Sold by
Garbs David N
Bought by
Jerome Glenn R and Phillips Greg F
Purchase Details
Closed on
Sep 24, 1993
Sold by
Garbs Elinor I and Garbs David N
Bought by
Garbs David N
Create a Home Valuation Report for This Property
The Home Valuation Report is an in-depth analysis detailing your home's value as well as a comparison with similar homes in the area
Home Values in the Area
Average Home Value in this Area
Purchase History
| Date | Buyer | Sale Price | Title Company |
|---|---|---|---|
| Dorman Cody | $211,000 | None Listed On Document | |
| Dorman Cody | $211,000 | None Listed On Document | |
| Miller Ken | $200,000 | Colorado Escrow & Title | |
| Wong Patrick Kin Fai | $29,900 | Land Title | |
| Garbs David N | -- | Land Title | |
| Phillips Greg F | -- | -- | |
| Jerome Glenn R | $22,900 | -- | |
| Garbs David N | -- | -- |
Source: Public Records
Mortgage History
| Date | Status | Borrower | Loan Amount |
|---|---|---|---|
| Open | Dorman Cody | $204,670 | |
| Closed | Dorman Cody | $204,670 |
Source: Public Records
Tax History Compared to Growth
Tax History
| Year | Tax Paid | Tax Assessment Tax Assessment Total Assessment is a certain percentage of the fair market value that is determined by local assessors to be the total taxable value of land and additions on the property. | Land | Improvement |
|---|---|---|---|---|
| 2024 | $1,125 | $14,210 | $2,450 | $11,760 |
| 2023 | $1,101 | $14,210 | $2,450 | $11,760 |
| 2022 | $1,305 | $16,410 | $2,540 | $13,870 |
| 2021 | $1,260 | $16,890 | $2,620 | $14,270 |
| 2020 | $1,287 | $17,340 | $2,290 | $15,050 |
| 2019 | $1,250 | $17,340 | $2,290 | $15,050 |
| 2018 | $1,159 | $14,980 | $2,140 | $12,840 |
| 2017 | $1,155 | $14,980 | $2,140 | $12,840 |
| 2016 | $1,013 | $12,420 | $2,364 | $10,056 |
| 2015 | $970 | $12,420 | $2,364 | $10,056 |
| 2014 | $731 | $8,800 | $1,512 | $7,288 |
Source: Public Records
Map
Nearby Homes
- 1243 N Washington St Unit 105
- 1243 N Washington St Unit 406
- 1243 N Washington St Unit 308
- 1225 N Emerson St Unit B
- 1266 N Pearl St
- 1215 N Emerson St Unit A
- 1351 N Washington St Unit 15
- 1214 N Pearl St Unit 1
- 1356 N Pearl St Unit 202
- 1255 N Ogden St Unit 604
- 1255 N Ogden St Unit 305
- 1255 N Ogden St Unit 406
- 1255 N Ogden St Unit 605
- 1233 N Ogden St Unit 503
- 1233 N Ogden St Unit 312
- 1390 N Emerson St Unit 101
- 1390 N Emerson St Unit 407
- 1390 N Emerson St Unit 105
- 1125 N Washington St Unit 206
- 1125 N Washington St Unit 501
- 1275 Clarkson St Unit 17G
- 1275 Clarkson St Unit 16G
- 1275 Clarkson St Unit 15G
- 1275 Clarkson St Unit 14G
- 1275 Clarkson St
- 1275 Clarkson St
- 1275 Clarkson St
- 1275 Clarkson St
- 1275 Clarkson St Unit 8
- 1275 Clarkson St Unit 7
- 1275 Clarkson St Unit 5
- 1275 Clarkson St
- 1275 Clarkson St Unit 3
- 1275 Clarkson St Unit 2
- 1275 Clarkson St Unit 1
- 1275 Clarkson St Unit 9
- 1275 N Clarkson St Unit 4
- 1275 N Clarkson St
- 1275 N Clarkson St Unit 5
- 1275 N Clarkson St Unit 16G