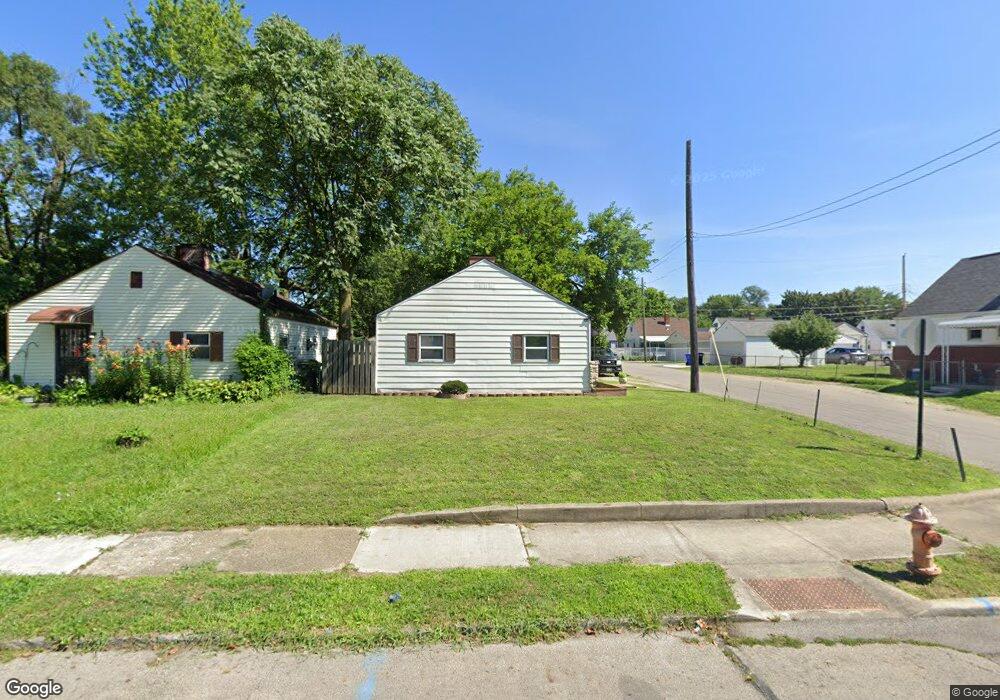
1276 E 15th Ave Columbus, OH 43211
South Linden NeighborhoodEstimated Value: $83,000 - $90,000
2
Beds
1
Bath
672
Sq Ft
$129/Sq Ft
Est. Value
About This Home
This home is located at 1276 E 15th Ave, Columbus, OH 43211 and is currently estimated at $86,492, approximately $128 per square foot. 1276 E 15th Ave is a home located in Franklin County with nearby schools including Windsor Stem Acadmey, Linden-Mckinley Stem School On Arcadia, and North Columbus Preparatory Academy.
Ownership History
Date
Name
Owned For
Owner Type
Purchase Details
Closed on
Jan 31, 2003
Sold by
Mid State Homes Inc
Bought by
Adedapo Samson O and Adedapo Veronica L
Current Estimated Value
Home Financials for this Owner
Home Financials are based on the most recent Mortgage that was taken out on this home.
Original Mortgage
$41,500
Outstanding Balance
$17,271
Interest Rate
6.06%
Mortgage Type
Seller Take Back
Estimated Equity
$69,221
Purchase Details
Closed on
Aug 27, 2002
Sold by
U S Bank National Assn
Bought by
Mid State Homes Inc
Purchase Details
Closed on
Jun 20, 2002
Sold by
Crowl John J
Bought by
U S Bank National Assn and Credit Based Asset Servicing & Securitiz
Purchase Details
Closed on
Jul 27, 1999
Sold by
Grant Roger D
Bought by
Crowl John J
Purchase Details
Closed on
Jan 14, 1982
Bought by
Grant Roger D
Create a Home Valuation Report for This Property
The Home Valuation Report is an in-depth analysis detailing your home's value as well as a comparison with similar homes in the area
Home Values in the Area
Average Home Value in this Area
Purchase History
| Date | Buyer | Sale Price | Title Company |
|---|---|---|---|
| Adedapo Samson O | $41,500 | Foundation Title Agency Inc | |
| Mid State Homes Inc | $20,000 | -- | |
| U S Bank National Assn | $18,600 | -- | |
| Crowl John J | $11,000 | Ohio Title Agency | |
| Grant Roger D | -- | -- |
Source: Public Records
Mortgage History
| Date | Status | Borrower | Loan Amount |
|---|---|---|---|
| Open | Adedapo Samson O | $41,500 |
Source: Public Records
Tax History
| Year | Tax Paid | Tax Assessment Tax Assessment Total Assessment is a certain percentage of the fair market value that is determined by local assessors to be the total taxable value of land and additions on the property. | Land | Improvement |
|---|---|---|---|---|
| 2025 | $892 | $19,470 | $5,430 | $14,040 |
| 2024 | $892 | $19,470 | $5,430 | $14,040 |
| 2023 | $881 | $19,470 | $5,430 | $14,040 |
| 2022 | $335 | $6,300 | $2,240 | $4,060 |
| 2021 | $335 | $6,300 | $2,240 | $4,060 |
| 2020 | $336 | $6,300 | $2,240 | $4,060 |
| 2019 | $326 | $5,250 | $1,890 | $3,360 |
| 2018 | $421 | $5,250 | $1,890 | $3,360 |
| 2017 | $446 | $5,250 | $1,890 | $3,360 |
| 2016 | $567 | $8,340 | $2,420 | $5,920 |
| 2015 | $516 | $8,340 | $2,420 | $5,920 |
| 2014 | $517 | $8,340 | $2,420 | $5,920 |
| 2013 | $300 | $9,275 | $2,695 | $6,580 |
Source: Public Records
Map
Nearby Homes
- 1249-1251 E 15th Ave
- 1315 E 18th Ave
- 0 Windsor Ave
- 1673 Cleveland Ave
- 1121 Windsor Ave
- 1111 Windsor Ave
- 1129 E 17th Ave
- 1437 E 19th Ave
- 1027 E 14th Ave
- 1386 E 22nd Ave
- 1218 E 22nd Ave
- 957 E 12th Ave
- 1136 E 21st Ave
- 1705 Lexington Ave
- 1538-1542 Accommodation Ave
- 1638 Joyce Ave
- 1951 Joyce Ave
- 1045-1051 E 20th Ave
- 957 E 17th Ave
- 915 E 13th Ave
- 1272 E 15th Ave
- 1266 E 15th Ave
- 1288 E 15th Ave
- 1294 E 15th Ave
- 1260 E 15th Ave
- 1285 E 16th Ave
- 1298 E 15th Ave
- 1279 E 16th Ave
- 1297 E 16th Ave
- 1256 E 15th Ave
- 1275 E 15th Ave
- 1271 E 15th Ave
- 1271 E 16th Ave
- 1302 E 15th Ave
- 1265 E 15th Ave
- 1285 E 15th Ave
- 1267 E 16th Ave
- 1303 E 16th Ave
- 1291 E 15th Ave
- 1259 E 15th Ave
Your Personal Tour Guide
Ask me questions while you tour the home.