Estimated Value: $607,663 - $797,000
12
Beds
8
Baths
2,342
Sq Ft
$314/Sq Ft
Est. Value
About This Home
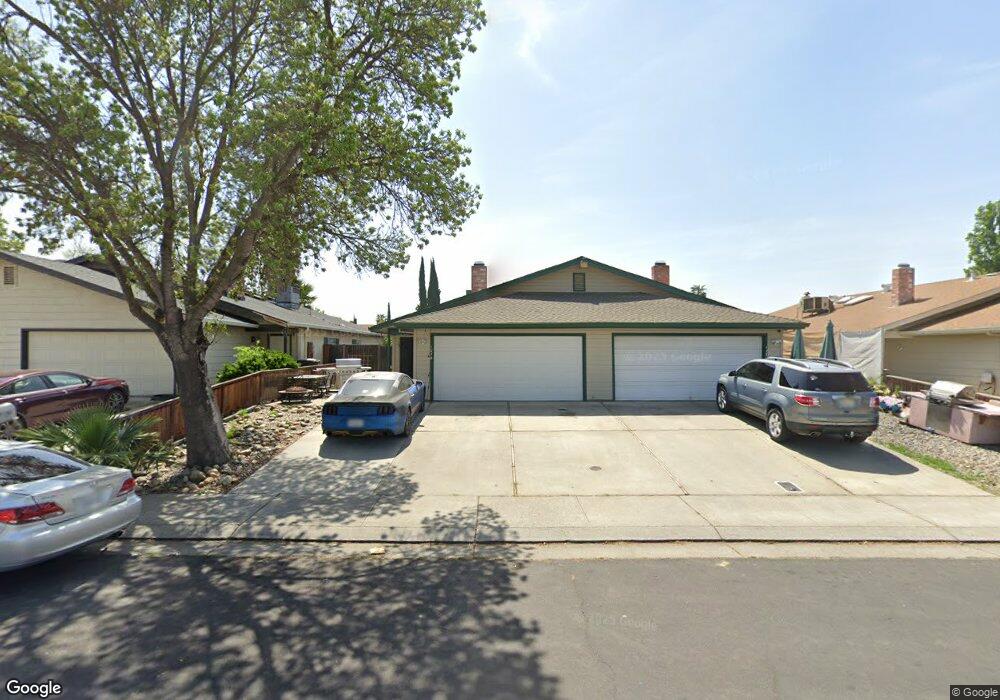
This home is located at 1276 Johnson Ct, Tracy, CA 95376 and is currently estimated at $735,666, approximately $314 per square foot. 1276 Johnson Ct is a home located in San Joaquin County with nearby schools including McKinley Elementary School, Monte Vista Middle School, and Merrill F. West High School.
Ownership History
Date
Name
Owned For
Owner Type
Purchase Details
Closed on
Jul 23, 2024
Sold by
Sousa Nuno T
Bought by
Sousa Family Trust and Sousa
Current Estimated Value
Purchase Details
Closed on
Dec 23, 2019
Sold by
Sousa Rui Jorge T
Bought by
Sousa Rui Jorge T and The Rui Jorge T Sousa Living T
Purchase Details
Closed on
Jul 11, 2002
Sold by
Sousa Renea
Bought by
Sousa Nuno T
Home Financials for this Owner
Home Financials are based on the most recent Mortgage that was taken out on this home.
Original Mortgage
$185,000
Interest Rate
6.7%
Purchase Details
Closed on
Feb 27, 1997
Sold by
Reed Delward G and Reed Joyce D
Bought by
Sousa Rui Jorge T and Sousa Nuno T
Home Financials for this Owner
Home Financials are based on the most recent Mortgage that was taken out on this home.
Original Mortgage
$126,000
Interest Rate
7.81%
Create a Home Valuation Report for This Property
The Home Valuation Report is an in-depth analysis detailing your home's value as well as a comparison with similar homes in the area
Home Values in the Area
Average Home Value in this Area
Purchase History
| Date | Buyer | Sale Price | Title Company |
|---|---|---|---|
| Sousa Family Trust | -- | None Listed On Document | |
| Sousa Rui Jorge T | -- | None Available | |
| Sousa Nuno T | -- | North American Title Co | |
| Sousa Nuno T | -- | North American Title Co | |
| Sousa Rui Jorge T | $180,000 | Chicago Title Co |
Source: Public Records
Mortgage History
| Date | Status | Borrower | Loan Amount |
|---|---|---|---|
| Previous Owner | Sousa Nuno T | $185,000 | |
| Previous Owner | Sousa Rui Jorge T | $126,000 |
Source: Public Records
Tax History
| Year | Tax Paid | Tax Assessment Tax Assessment Total Assessment is a certain percentage of the fair market value that is determined by local assessors to be the total taxable value of land and additions on the property. | Land | Improvement |
|---|---|---|---|---|
| 2025 | $3,394 | $293,140 | $81,426 | $211,714 |
| 2024 | $3,128 | $287,393 | $79,830 | $207,563 |
| 2023 | $3,080 | $281,759 | $78,265 | $203,494 |
| 2022 | $3,017 | $276,235 | $76,731 | $199,504 |
| 2021 | $2,982 | $270,820 | $75,227 | $195,593 |
| 2020 | $2,963 | $268,044 | $74,456 | $193,588 |
| 2019 | $2,917 | $262,790 | $72,997 | $189,793 |
| 2018 | $2,868 | $257,638 | $71,566 | $186,072 |
| 2017 | $2,725 | $252,587 | $70,163 | $182,424 |
| 2016 | $2,758 | $247,636 | $68,788 | $178,848 |
| 2014 | $2,573 | $215,000 | $53,000 | $162,000 |
Source: Public Records
Map
Nearby Homes
- 2270 Chester Dr
- 2198 Walsingham Ct
- 2214 Morningside Ct
- 875 Westleigh Ct
- 2901 San Rocco Ct
- 1861 Mcpeak Ct
- 508 W Grant Line Rd
- 812 W Clover Rd Unit 51
- 812 W Clover Rd Unit 66
- 1974 Paradise Valley Ct
- 539 W Lowell Ave
- 1533 Vinewood Way
- 1823 Wall St
- 1416 Audrey Dr
- 1930 Wall St
- 1651 W Beverly Place
- 1506 Madison Ave
- 535 W Carlton Way
- 445 W Lowell Ave
- 1463 Evergreen Ct
- 1300 Johnson Ct
- 1258 Johnson Ct
- 1323 Duncan Dr
- 1347 Duncan Dr
- 1301 Duncan Dr
- 1320 Johnson Ct
- 1371 Duncan Dr
- 1281 Johnson Ct
- 1311 Johnson Ct
- 1395 Duncan Dr
- 1247 Johnson Ct
- 1226 Johnson Ct
- 1338 Johnson Ct
- 1197 Duncan Dr
- 1327 Johnson Ct
- 1231 Johnson Ct
- 1401 Duncan Dr
- 1324 Duncan Dr
- 1348 Duncan Dr
- 1300 Duncan Dr