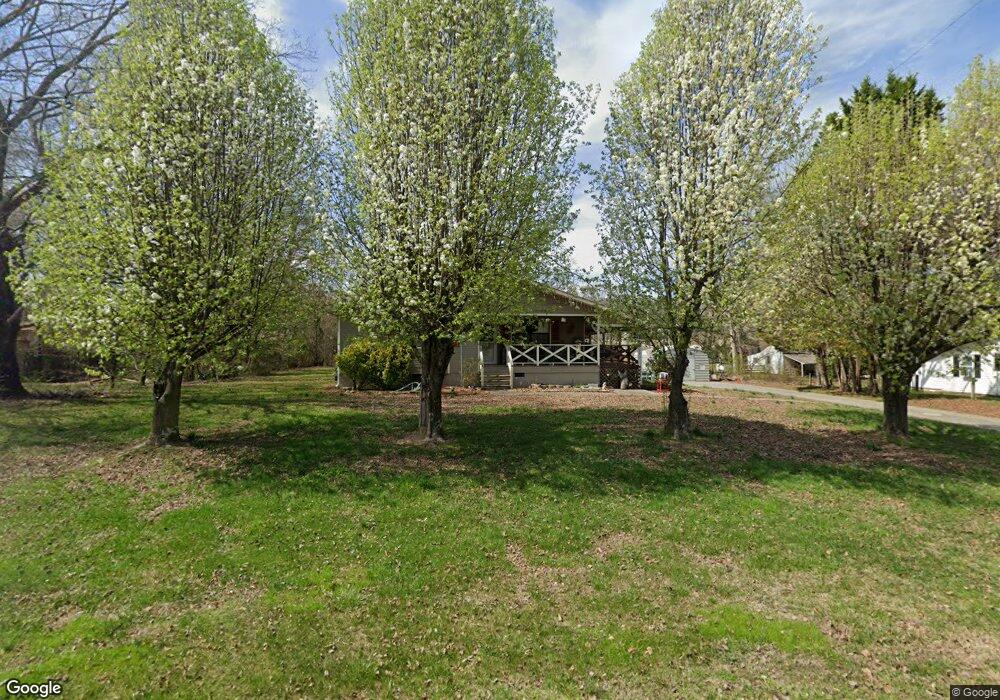
1276 Old Highway 27 Rock Spring, GA 30739
Rock Spring NeighborhoodEstimated Value: $238,000 - $266,000
3
Beds
2
Baths
1,300
Sq Ft
$195/Sq Ft
Est. Value
About This Home
This home is located at 1276 Old Highway 27, Rock Spring, GA 30739 and is currently estimated at $253,738, approximately $195 per square foot. 1276 Old Highway 27 is a home located in Walker County with nearby schools including Rock Spring Elementary School, Lafayette High School, and Alice M Daley Adventist School.
Ownership History
Date
Name
Owned For
Owner Type
Purchase Details
Closed on
May 26, 2009
Sold by
Turner Michael
Bought by
Turner Michael
Current Estimated Value
Home Financials for this Owner
Home Financials are based on the most recent Mortgage that was taken out on this home.
Original Mortgage
$103,785
Outstanding Balance
$65,573
Interest Rate
4.77%
Mortgage Type
FHA
Estimated Equity
$188,165
Purchase Details
Closed on
Sep 24, 2001
Sold by
Wheeler Lamon D
Bought by
Turner Michael
Purchase Details
Closed on
Jun 5, 2001
Sold by
Wheeler Lamon D and Wheeler Wanda S
Bought by
Wheeler Lamon D
Purchase Details
Closed on
Sep 13, 1996
Sold by
Sorenson Donita V
Bought by
Wheeler Lamon D and Wheeler Wanda S
Purchase Details
Closed on
Jul 3, 1990
Sold by
Thacker Joseph T and Thacker Wf
Bought by
Sorenson Donita V
Purchase Details
Closed on
Feb 13, 1970
Bought by
Thacker Joseph T and Thacker Wf
Create a Home Valuation Report for This Property
The Home Valuation Report is an in-depth analysis detailing your home's value as well as a comparison with similar homes in the area
Home Values in the Area
Average Home Value in this Area
Purchase History
| Date | Buyer | Sale Price | Title Company |
|---|---|---|---|
| Turner Michael | -- | -- | |
| Turner Michael | $83,000 | -- | |
| Wheeler Lamon D | -- | -- | |
| Wheeler Lamon D | $71,000 | -- | |
| Sorenson Donita V | $54,000 | -- | |
| Thacker Joseph T | -- | -- |
Source: Public Records
Mortgage History
| Date | Status | Borrower | Loan Amount |
|---|---|---|---|
| Open | Turner Michael | $103,785 |
Source: Public Records
Tax History Compared to Growth
Tax History
| Year | Tax Paid | Tax Assessment Tax Assessment Total Assessment is a certain percentage of the fair market value that is determined by local assessors to be the total taxable value of land and additions on the property. | Land | Improvement |
|---|---|---|---|---|
| 2024 | $1,922 | $87,560 | $5,525 | $82,035 |
| 2023 | $1,896 | $82,641 | $4,385 | $78,256 |
| 2022 | $1,807 | $72,111 | $3,801 | $68,310 |
| 2021 | $1,502 | $53,261 | $3,801 | $49,460 |
| 2020 | $1,245 | $41,710 | $3,801 | $37,909 |
| 2019 | $1,267 | $41,710 | $3,801 | $37,909 |
| 2018 | $1,104 | $41,710 | $3,801 | $37,909 |
| 2017 | $1,381 | $41,710 | $3,801 | $37,909 |
| 2016 | $1,151 | $41,710 | $3,801 | $37,909 |
| 2015 | $1,103 | $37,346 | $6,228 | $31,118 |
| 2014 | $1,007 | $37,346 | $6,228 | $31,118 |
| 2013 | -- | $37,346 | $6,228 | $31,118 |
Source: Public Records
Map
Nearby Homes
- 1370 Old Highway 27
- 1003 Highway N Old 27
- 701 Bicentennial Trail
- 10180 Us Highway 27
- 5602 Georgia 95
- 00 Georgia 95
- 1902 Long Hollow Rd
- 15 Willow Cir
- 23 Willow Cir
- 16 Willow Cir
- 11 Willow Cir
- 954 Goodson Cir
- The Pearson Plan at Laurel Ridge
- The Benson II Plan at Laurel Ridge
- The Langford Plan at Laurel Ridge
- The Lawson Plan at Laurel Ridge
- The Piedmont Plan at Laurel Ridge
- The Coleman Plan at Laurel Ridge
- The McGinnis Plan at Laurel Ridge
- The Caldwell Plan at Laurel Ridge
- 1306 Old Highway 27
- 41 Fields Dr
- 27 Us Highway 27
- 8864 Us Highway 27
- 6622 Us Highway 27
- 6620 Us Highway 27
- 74 Fields Dr
- 1340 Old Highway 27
- 0 Pin Oak Dr Unit 1140683
- 0 Pin Oak Dr
- 0 Pin Oak Dr Unit 1035931
- 0 Pin Oak Dr Unit 1035930
- 13 Pinewood Dr
- 14 Pinewood Dr
- 296 Fields Dr
- 100 Pin Oak Dr
- 7403 U S 27
- 760 Bicentennial Trail
- 702 Bicentennial Trail
- 778 Bicentennial Trail