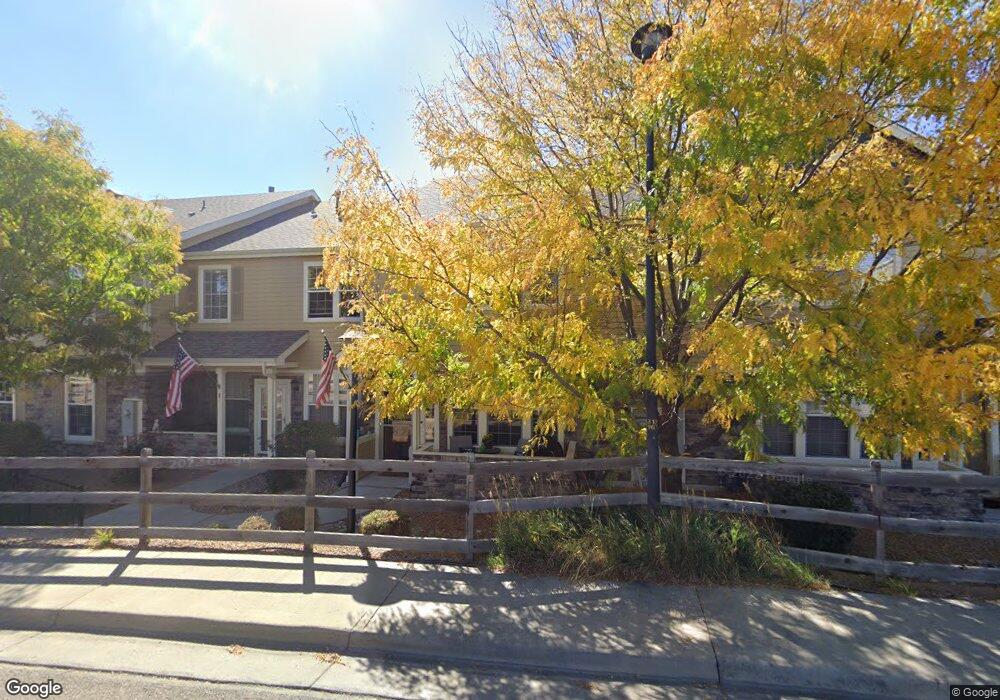
12763 Leyden St Unit C Thornton, CO 80602
Estimated Value: $415,000 - $442,000
3
Beds
3
Baths
1,674
Sq Ft
$256/Sq Ft
Est. Value
About This Home
This home is located at 12763 Leyden St Unit C, Thornton, CO 80602 and is currently estimated at $429,119, approximately $256 per square foot. 12763 Leyden St Unit C is a home located in Adams County with nearby schools including West Ridge Elementary School, Shore Acres Elementary School, and Elderberry Elementary.
Ownership History
Date
Name
Owned For
Owner Type
Purchase Details
Closed on
Aug 28, 2015
Sold by
Carr Seth A and Carr Jessica A
Bought by
Bhardwaja Ramesh C and Bhardwaja Jagdish R
Current Estimated Value
Purchase Details
Closed on
Jan 15, 2015
Sold by
Coolidge Karen A
Bought by
Voorhies Nathan A and Voorhies Karen C
Purchase Details
Closed on
Mar 22, 2007
Sold by
Centex Homes
Bought by
Carr Seth E and Carr Jessica A
Home Financials for this Owner
Home Financials are based on the most recent Mortgage that was taken out on this home.
Original Mortgage
$215,326
Interest Rate
6.26%
Mortgage Type
Unknown
Create a Home Valuation Report for This Property
The Home Valuation Report is an in-depth analysis detailing your home's value as well as a comparison with similar homes in the area
Home Values in the Area
Average Home Value in this Area
Purchase History
| Date | Buyer | Sale Price | Title Company |
|---|---|---|---|
| Bhardwaja Ramesh C | $261,000 | Land Title Guarantee Company | |
| Voorhies Nathan A | -- | None Available | |
| Carr Seth E | $215,326 | Commerce Title |
Source: Public Records
Mortgage History
| Date | Status | Borrower | Loan Amount |
|---|---|---|---|
| Previous Owner | Carr Seth E | $215,326 |
Source: Public Records
Tax History Compared to Growth
Tax History
| Year | Tax Paid | Tax Assessment Tax Assessment Total Assessment is a certain percentage of the fair market value that is determined by local assessors to be the total taxable value of land and additions on the property. | Land | Improvement |
|---|---|---|---|---|
| 2024 | $2,473 | $26,440 | $5,310 | $21,130 |
| 2023 | $2,461 | $29,090 | $4,740 | $24,350 |
| 2022 | $2,304 | $23,490 | $4,380 | $19,110 |
| 2021 | $2,219 | $23,490 | $4,380 | $19,110 |
| 2020 | $2,124 | $23,460 | $4,500 | $18,960 |
| 2019 | $2,126 | $23,460 | $4,500 | $18,960 |
| 2018 | $1,974 | $21,770 | $1,370 | $20,400 |
| 2017 | $1,971 | $21,770 | $1,370 | $20,400 |
| 2016 | $1,367 | $15,050 | $1,510 | $13,540 |
| 2015 | $1,364 | $15,050 | $1,510 | $13,540 |
| 2014 | -- | $11,810 | $1,510 | $10,300 |
Source: Public Records
Map
Nearby Homes
- 12774 Leyden St Unit D
- 12733 Leyden St Unit C
- 12754 Leyden St Unit E
- 12778 Jasmine St Unit E
- 12740 Jasmine St Unit F
- 12812 Jasmine St Unit C
- 12682 Kearney St
- 12926 Jasmine Ct
- 12774 Jasmine Ct
- 12771 Jasmine Ct
- 12792 Ivy St
- 12845 Jasmine Way
- 6731 E 128th Place
- 12797 Ivy St
- 12609 Jersey Cir W
- 12741 Ivanhoe St
- 15372 Jersey Ct
- 6791 E 129th Ave
- Pearl Plan at Creekside Village
- Hemingway Plan at Creekside Village
- 12763 Leyden St Unit D
- 12763 Leyden St Unit A
- 12763 Leyden St Unit C-D
- 12763 Leyden St Unit B
- 12763 Leyden St Unit C-C
- 12763 Leyden St Unit CB
- 12753 Leyden St Unit E
- 12753 Leyden St Unit D
- 12753 Leyden St Unit B
- 12753 Leyden St Unit A
- 12753 Leyden St Unit FD
- 12753 Leyden Unit B St
- 12753 Leyden Unit C St
- 12753 Leyden Unit D St
- 12773 Leyden St Unit B
- 12773 Leyden St Unit C
- 12773 Leyden St Unit D
- 12773 Leyden St Unit E
- 12773 Leyden St Unit F
- 12763C Leyden St Unit D