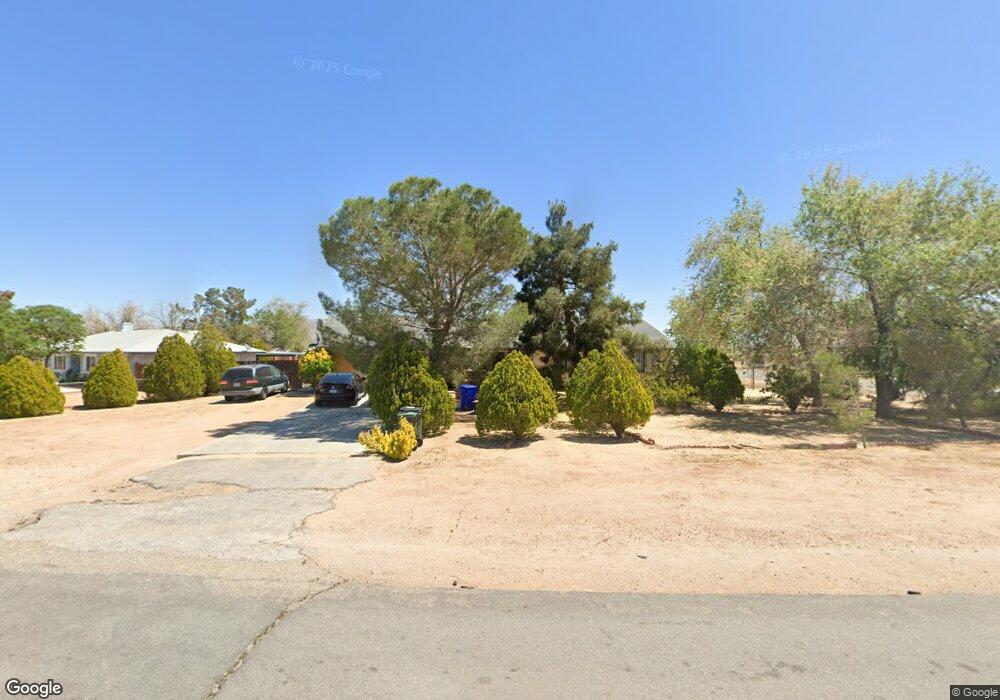
12765 Pawnee Rd Apple Valley, CA 92308
High Desert NeighborhoodEstimated Value: $363,312 - $400,000
3
Beds
2
Baths
1,357
Sq Ft
$276/Sq Ft
Est. Value
About This Home
This home is located at 12765 Pawnee Rd, Apple Valley, CA 92308 and is currently estimated at $374,828, approximately $276 per square foot. 12765 Pawnee Rd is a home located in San Bernardino County with nearby schools including Sandia Elementary School and Apple Valley High School.
Ownership History
Date
Name
Owned For
Owner Type
Purchase Details
Closed on
Nov 12, 1996
Sold by
Hud
Bought by
Rodriguez Marvin and Rodriguez Mariam
Current Estimated Value
Home Financials for this Owner
Home Financials are based on the most recent Mortgage that was taken out on this home.
Original Mortgage
$65,593
Outstanding Balance
$6,333
Interest Rate
7.86%
Mortgage Type
FHA
Estimated Equity
$368,495
Purchase Details
Closed on
Jun 10, 1996
Sold by
Midfirst Bank
Bought by
Hud
Purchase Details
Closed on
Jan 5, 1996
Sold by
Rutherford Davy L
Bought by
Midfirst Bank and Midfirst S&L Assn
Purchase Details
Closed on
Jan 31, 1994
Sold by
Oconnor Kelly J
Bought by
Loera Antonio D and Loera Antonia
Home Financials for this Owner
Home Financials are based on the most recent Mortgage that was taken out on this home.
Original Mortgage
$8,000
Interest Rate
7.19%
Mortgage Type
Seller Take Back
Create a Home Valuation Report for This Property
The Home Valuation Report is an in-depth analysis detailing your home's value as well as a comparison with similar homes in the area
Home Values in the Area
Average Home Value in this Area
Purchase History
| Date | Buyer | Sale Price | Title Company |
|---|---|---|---|
| Rodriguez Marvin | $67,000 | Gateway Title Company | |
| Hud | -- | United Title Company | |
| Midfirst Bank | $97,243 | United Title Company | |
| Loera Antonio D | $4,000 | Continental Lawyers Title Co |
Source: Public Records
Mortgage History
| Date | Status | Borrower | Loan Amount |
|---|---|---|---|
| Open | Rodriguez Marvin | $65,593 | |
| Previous Owner | Loera Antonio D | $8,000 |
Source: Public Records
Tax History
| Year | Tax Paid | Tax Assessment Tax Assessment Total Assessment is a certain percentage of the fair market value that is determined by local assessors to be the total taxable value of land and additions on the property. | Land | Improvement |
|---|---|---|---|---|
| 2025 | $1,347 | $107,490 | $13,028 | $94,462 |
| 2024 | $1,632 | $105,383 | $12,773 | $92,610 |
| 2023 | $1,297 | $103,317 | $12,523 | $90,794 |
| 2022 | $1,277 | $101,291 | $12,277 | $89,014 |
| 2021 | $1,248 | $99,305 | $12,036 | $87,269 |
| 2020 | $1,233 | $98,287 | $11,913 | $86,374 |
| 2019 | $1,210 | $96,359 | $11,679 | $84,680 |
| 2018 | $1,181 | $94,470 | $11,450 | $83,020 |
| 2017 | $1,164 | $92,617 | $11,225 | $81,392 |
| 2016 | $1,086 | $90,801 | $11,005 | $79,796 |
| 2015 | $1,070 | $89,437 | $10,840 | $78,597 |
| 2014 | $1,056 | $87,685 | $10,628 | $77,057 |
Source: Public Records
Map
Nearby Homes
- 0 Chief Joseph Rd
- 0 Navajo Way
- 12794 Navajo Rd
- 22020 Nisqually Rd Unit 49
- 22020 Nisqually Rd Unit 73
- 0 Pahute Rd Unit HD25164188
- 0 Pahute Rd Unit HD26005960
- 22035 Pahute Rd
- 12744 Running Deer Rd
- 13020 Ojai Rd
- 13285 Osage Rd
- 12442 Quinnault Rd
- 13071 Clallam Rd
- 22241 Nisqually Rd Unit 103
- 22241 Nisqually Rd Unit 118
- 22241 Nisqually Rd Unit 74
- 22241 Nisqually Rd Unit 143
- 22241 Nisqually Rd Unit 63
- 22241 Nisqually Rd Unit 31
- 22241 Nisqually Rd Unit 20
- 12785 Pawnee Rd
- 12721 Pawnee Rd
- 12795 Pawnee Rd
- 21890 Little Beaver Rd
- 12768 Pawnee Rd
- 12774 Pawnee Rd
- 12782 Pawnee Rd
- 21815 Little Beaver Rd
- 21908 Maumee Rd
- 12809 Pawnee Rd
- 12711 Pawnee Rd
- 12794 Pawnee Rd
- 21920 Maumee Rd
- 12706 Pawnee Rd
- 12816 Pawnee Rd
- 12815 Pawnee Rd
- 12712 Pawnee Rd
- 12765 Chief Joseph Rd
- 12785 Chief Joseph Rd
- 12735 Chief Joseph Rd
Your Personal Tour Guide
Ask me questions while you tour the home.