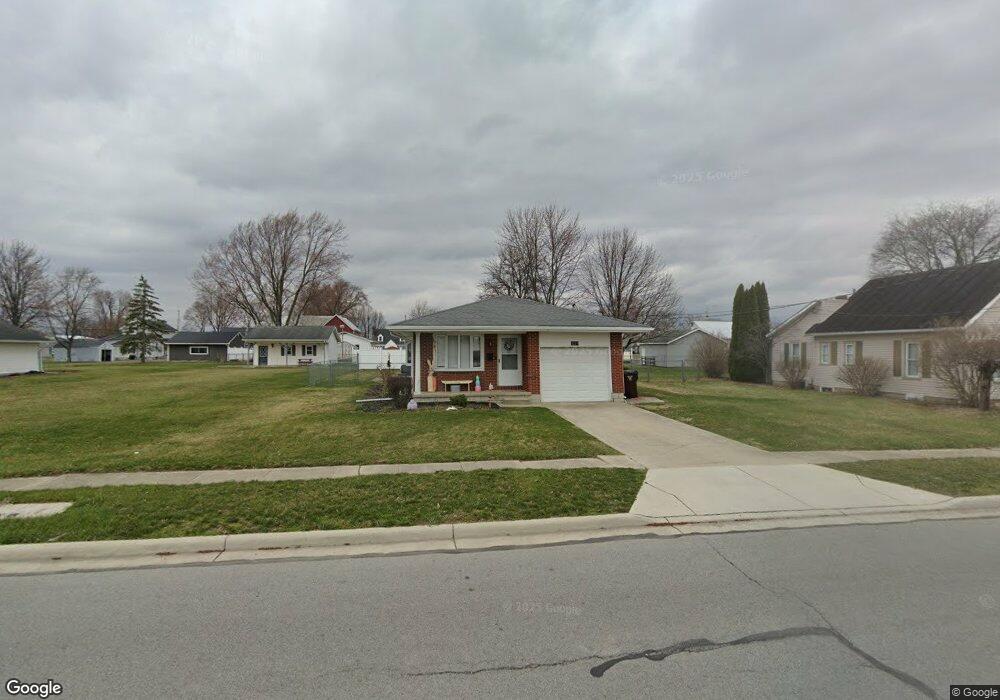
1277 E 2nd St Ottawa, OH 45875
Estimated Value: $170,000 - $210,000
3
Beds
1
Bath
980
Sq Ft
$196/Sq Ft
Est. Value
About This Home
This home is located at 1277 E 2nd St, Ottawa, OH 45875 and is currently estimated at $191,984, approximately $195 per square foot. 1277 E 2nd St is a home located in Putnam County with nearby schools including Ottawa-Glandorf High School and Sts. Peter & Paul Catholic School.
Ownership History
Date
Name
Owned For
Owner Type
Purchase Details
Closed on
Apr 18, 2024
Sold by
Johnson Nichole Y and Shafer Nichole Y
Bought by
Okuley Jonathon M and Okuley Angela S
Current Estimated Value
Purchase Details
Closed on
Oct 29, 2019
Sold by
Zimmerly Joan M
Bought by
Johnson Nichole Y
Home Financials for this Owner
Home Financials are based on the most recent Mortgage that was taken out on this home.
Original Mortgage
$91,600
Interest Rate
3.7%
Mortgage Type
New Conventional
Purchase Details
Closed on
Nov 3, 2010
Sold by
Maag Angela and Maag Michael J
Bought by
Zimmerly Joan M
Home Financials for this Owner
Home Financials are based on the most recent Mortgage that was taken out on this home.
Original Mortgage
$50,000
Interest Rate
4.37%
Mortgage Type
New Conventional
Purchase Details
Closed on
Jul 5, 2003
Bought by
Maag Angela
Create a Home Valuation Report for This Property
The Home Valuation Report is an in-depth analysis detailing your home's value as well as a comparison with similar homes in the area
Home Values in the Area
Average Home Value in this Area
Purchase History
| Date | Buyer | Sale Price | Title Company |
|---|---|---|---|
| Okuley Jonathon M | $170,000 | None Listed On Document | |
| Johnson Nichole Y | $114,500 | None Available | |
| Zimmerly Joan M | $75,000 | Attorney | |
| Maag Angela | $83,100 | -- |
Source: Public Records
Mortgage History
| Date | Status | Borrower | Loan Amount |
|---|---|---|---|
| Previous Owner | Johnson Nichole Y | $91,600 | |
| Previous Owner | Zimmerly Joan M | $50,000 |
Source: Public Records
Tax History
| Year | Tax Paid | Tax Assessment Tax Assessment Total Assessment is a certain percentage of the fair market value that is determined by local assessors to be the total taxable value of land and additions on the property. | Land | Improvement |
|---|---|---|---|---|
| 2025 | $1,374 | $40,350 | $4,990 | $35,360 |
| 2024 | $1,294 | $40,040 | $4,990 | $35,050 |
| 2023 | $1,336 | $31,680 | $3,870 | $27,810 |
| 2022 | $1,198 | $31,682 | $3,871 | $27,811 |
| 2021 | $1,204 | $31,680 | $3,870 | $27,810 |
| 2020 | $1,211 | $24,490 | $3,470 | $21,020 |
| 2019 | $1,013 | $26,370 | $3,870 | $22,500 |
| 2018 | $994 | $26,370 | $3,870 | $22,500 |
| 2017 | $915 | $26,370 | $3,870 | $22,500 |
| 2016 | $915 | $24,490 | $3,470 | $21,020 |
| 2015 | $921 | $24,490 | $3,470 | $21,020 |
| 2014 | $910 | $24,490 | $3,470 | $21,020 |
| 2013 | $907 | $24,490 | $3,470 | $21,020 |
Source: Public Records
Map
Nearby Homes
- 238 N Ohio Ave
- 1535 E 3rd St
- 1731 S Agner St
- 740 E Main St
- 1823 S Agner St
- 717 E 2nd St
- 370 S Thomas St
- 0 Sapphire St Unit 225029940
- 0 Sapphire St Unit 225046385
- 1997 E Main St
- 715 N Perry St
- 717 & 717 1/2 & 721 E Third St
- 331 Chippewa Dr
- 309 Oakview Dr
- 113 Crabapple Ln
- 9896 Road M
- 5666 State Route 224
- 9410 Road H
- 12806 Road K
- 13592 Ohio 694
Your Personal Tour Guide
Ask me questions while you tour the home.