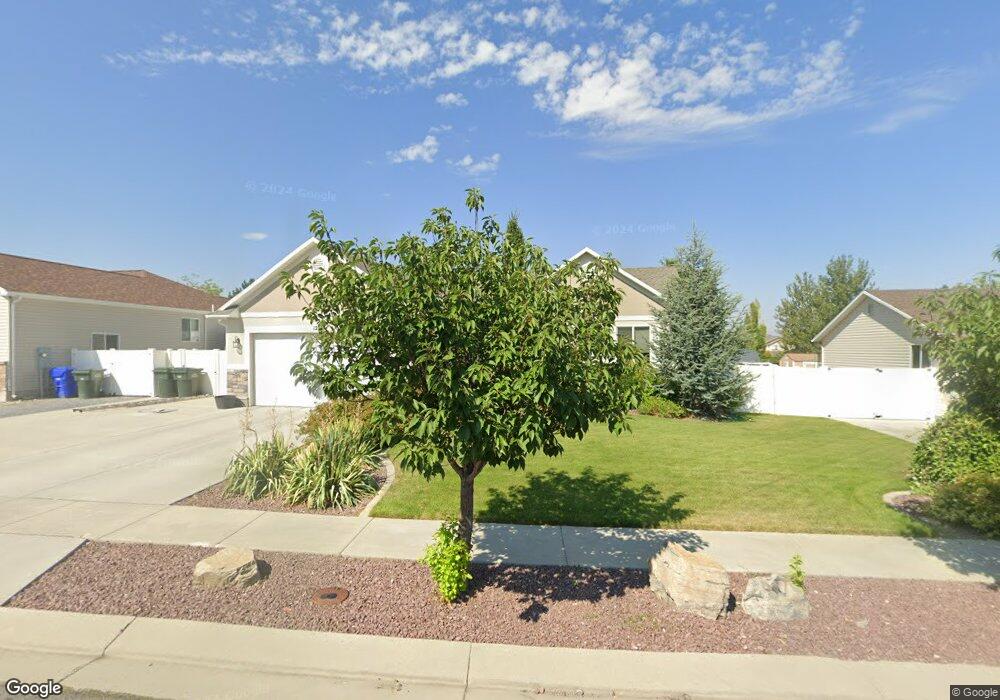
1277 N 690 E Unit 2 Tooele, UT 84074
Estimated Value: $444,000 - $526,000
--
Bed
--
Bath
2,578
Sq Ft
$187/Sq Ft
Est. Value
About This Home
This home is located at 1277 N 690 E Unit 2, Tooele, UT 84074 and is currently estimated at $480,826, approximately $186 per square foot. 1277 N 690 E Unit 2 is a home located in Tooele County with nearby schools including Middle Canyon Elementary School, Tooele Junior High School, and Tooele High School.
Ownership History
Date
Name
Owned For
Owner Type
Purchase Details
Closed on
May 7, 2019
Sold by
Shinkle Debra Sue
Bought by
Rowberry Neil
Current Estimated Value
Home Financials for this Owner
Home Financials are based on the most recent Mortgage that was taken out on this home.
Original Mortgage
$285,000
Outstanding Balance
$255,867
Interest Rate
4.2%
Mortgage Type
USDA
Estimated Equity
$224,959
Purchase Details
Closed on
Dec 15, 2014
Sold by
Bach Homes Llc
Bought by
Shinkle Debra Sue
Home Financials for this Owner
Home Financials are based on the most recent Mortgage that was taken out on this home.
Original Mortgage
$12,112,014
Interest Rate
3.96%
Mortgage Type
New Conventional
Purchase Details
Closed on
Aug 12, 2013
Sold by
Maple Hills 3 Development Company Llc
Bought by
Bach Investments Llc
Create a Home Valuation Report for This Property
The Home Valuation Report is an in-depth analysis detailing your home's value as well as a comparison with similar homes in the area
Home Values in the Area
Average Home Value in this Area
Purchase History
| Date | Buyer | Sale Price | Title Company |
|---|---|---|---|
| Rowberry Neil | -- | Metro National Title | |
| Shinkle Debra Sue | -- | Meridian Title Company | |
| Bach Homes Llc | -- | Meridin Title Company | |
| Bach Investments Llc | -- | Metro National Title |
Source: Public Records
Mortgage History
| Date | Status | Borrower | Loan Amount |
|---|---|---|---|
| Open | Rowberry Neil | $285,000 | |
| Previous Owner | Bach Homes Llc | $12,112,014 |
Source: Public Records
Tax History Compared to Growth
Tax History
| Year | Tax Paid | Tax Assessment Tax Assessment Total Assessment is a certain percentage of the fair market value that is determined by local assessors to be the total taxable value of land and additions on the property. | Land | Improvement |
|---|---|---|---|---|
| 2025 | $2,854 | $238,085 | $60,500 | $177,585 |
| 2024 | $3,127 | $238,666 | $60,500 | $178,166 |
| 2023 | $3,127 | $249,121 | $57,608 | $191,513 |
| 2022 | $2,778 | $239,015 | $58,094 | $180,921 |
| 2021 | $2,257 | $162,408 | $23,238 | $139,170 |
| 2020 | $2,215 | $276,543 | $42,250 | $234,293 |
| 2019 | $1,833 | $225,091 | $42,250 | $182,841 |
| 2018 | $1,841 | $214,297 | $45,000 | $169,297 |
| 2017 | $1,494 | $206,462 | $30,000 | $176,462 |
| 2016 | $1,387 | $100,895 | $16,500 | $84,395 |
| 2015 | $1,387 | $100,895 | $0 | $0 |
| 2014 | -- | $30,000 | $0 | $0 |
Source: Public Records
Map
Nearby Homes