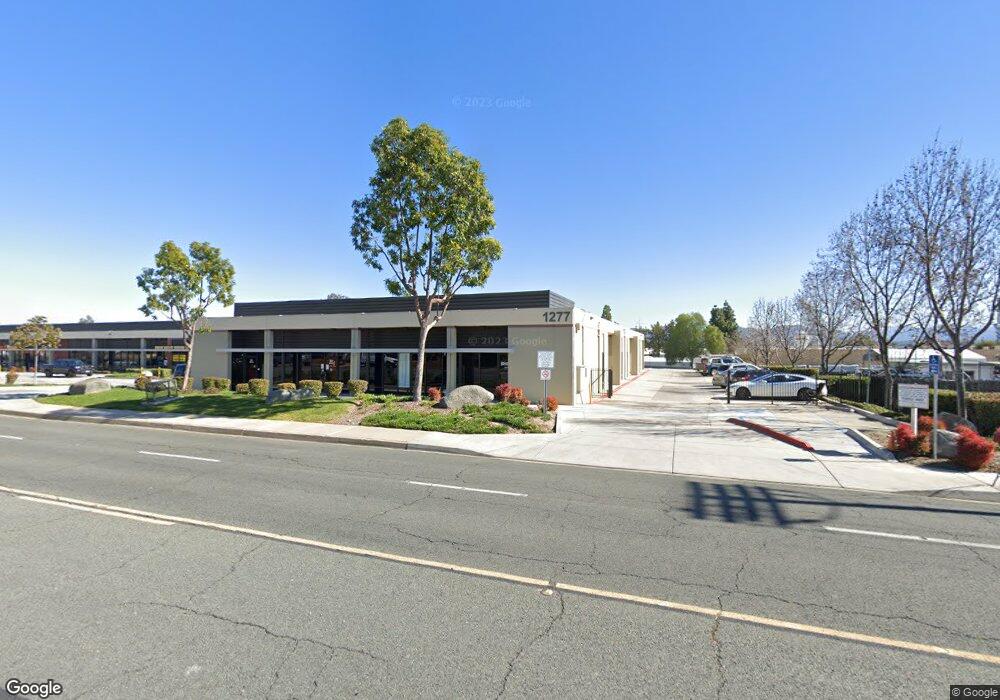
1277 N Cuyamaca St El Cajon, CA 92020
Estimated Value: $982,739
--
Bed
--
Bath
1,752
Sq Ft
$561/Sq Ft
Est. Value
About This Home
This home is located at 1277 N Cuyamaca St, El Cajon, CA 92020 and is currently estimated at $982,739, approximately $560 per square foot. 1277 N Cuyamaca St is a home located in San Diego County with nearby schools including Flying Hills Elementary School, Grossmont High School, and Grossmont Secondary School.
Ownership History
Date
Name
Owned For
Owner Type
Purchase Details
Closed on
Sep 7, 2023
Sold by
Hodgson Family Trust
Bought by
Akan Ca Real Estate Group Llc
Current Estimated Value
Home Financials for this Owner
Home Financials are based on the most recent Mortgage that was taken out on this home.
Original Mortgage
$1,736,500
Outstanding Balance
$1,701,163
Interest Rate
7.18%
Mortgage Type
New Conventional
Estimated Equity
-$718,424
Purchase Details
Closed on
Aug 21, 2019
Sold by
Barca Christopher M
Bought by
Hodgson David R and Hodgson Julie A
Home Financials for this Owner
Home Financials are based on the most recent Mortgage that was taken out on this home.
Original Mortgage
$253,000
Interest Rate
3.7%
Mortgage Type
Commercial
Purchase Details
Closed on
Dec 7, 2015
Sold by
Barca Christopher M
Bought by
Barca Christopher M
Purchase Details
Closed on
Nov 7, 2007
Sold by
Jackson Pendo Cuyamaca Street Lp
Bought by
Barca Christopher M
Create a Home Valuation Report for This Property
The Home Valuation Report is an in-depth analysis detailing your home's value as well as a comparison with similar homes in the area
Home Values in the Area
Average Home Value in this Area
Purchase History
| Date | Buyer | Sale Price | Title Company |
|---|---|---|---|
| Akan Ca Real Estate Group Llc | $900,000 | First American Title | |
| Hodgson David R | $494,000 | Chicago Title Company | |
| Barca Christopher M | -- | None Available | |
| Barca Christopher M | -- | First American Title |
Source: Public Records
Mortgage History
| Date | Status | Borrower | Loan Amount |
|---|---|---|---|
| Open | Akan Ca Real Estate Group Llc | $1,736,500 | |
| Previous Owner | Hodgson David R | $253,000 |
Source: Public Records
Tax History Compared to Growth
Tax History
| Year | Tax Paid | Tax Assessment Tax Assessment Total Assessment is a certain percentage of the fair market value that is determined by local assessors to be the total taxable value of land and additions on the property. | Land | Improvement |
|---|---|---|---|---|
| 2025 | $6,691 | $552,840 | $178,500 | $374,340 |
| 2024 | $6,691 | $542,000 | $175,000 | $367,000 |
| 2023 | $3,844 | $309,044 | $151,368 | $157,676 |
| 2022 | $3,776 | $302,985 | $148,400 | $154,585 |
| 2021 | $3,726 | $297,045 | $145,491 | $151,554 |
| 2020 | $3,687 | $294,000 | $144,000 | $150,000 |
| 2019 | $3,663 | $290,000 | $167,000 | $123,000 |
| 2018 | $3,365 | $265,000 | $153,000 | $112,000 |
| 2017 | $3,376 | $265,000 | $153,000 | $112,000 |
| 2016 | $3,280 | $265,000 | $153,000 | $112,000 |
| 2015 | $3,140 | $250,000 | $145,000 | $105,000 |
| 2014 | $3,151 | $250,000 | $145,000 | $105,000 |
Source: Public Records
Map
Nearby Homes
- 1340 Heron Ave
- 1677 Heron Ave
- 0 Hacienda Dr
- 741 N Pierce St
- 731 Dewane Dr
- 701 El Monte Rd
- 1387 Weers St
- 2052 Flying Hills Ln
- 2106 Windmill View Rd
- 1958 Milford Place
- 2161 Puesta Place
- 589 N Johnson Ave Unit 247
- 589 N Johnson Ave Unit 130
- 2148 Estela Dr
- 370 N Cuyamaca St
- 1423 Graves Ave Unit 238
- 1423 Graves Ave Unit 172
- 1423 Graves Ave Unit 242
- 1423 Graves Ave Unit 240
- 1673 Hillsmont Dr
- 1331 N Cuyamaca St
- 1277 N Cuyamaca St
- 1331 N Cuyamaca St
- 1277 N Cuyamaca St
- 1277 1277 N CuyaMacA St
- 1277 1277 N CuyaMacA #F
- 1369 N Cuyamaca St
- 1369 N Cuyamaca St
- 1555 N Cuyamaca St
- 1310 Swallow Dr
- 1398 N Cuyamaca St Unit 4
- 1398 N Cuyamaca St Unit 3
- 1398 N Cuyamaca St Unit 2
- 1398 N Cuyamaca St Unit 1
- 1386 N North Cuyamaca
- 1322 Swallow Dr
- 1386 N Cuyamaca St Unit 1
- 1374 N Cuyamaca St
- 1334 Swallow Dr
- 1362 N Cuyamaca St Unit 2