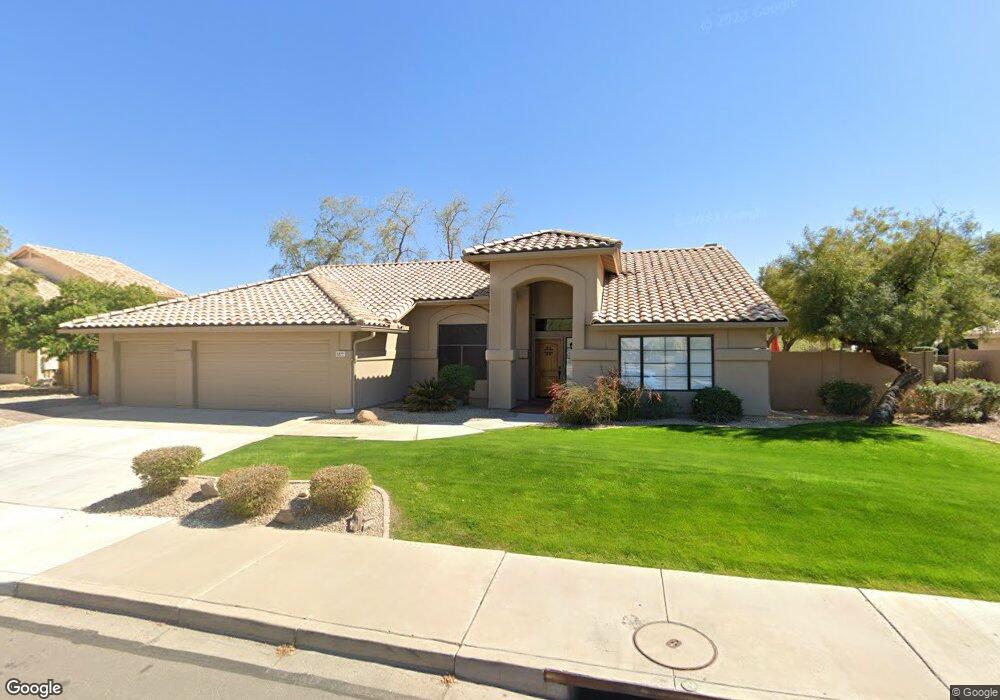
1277 N Hazelton Dr Chandler, AZ 85226
West Chandler NeighborhoodEstimated Value: $623,524 - $721,000
--
Bed
3
Baths
2,433
Sq Ft
$281/Sq Ft
Est. Value
About This Home
This home is located at 1277 N Hazelton Dr, Chandler, AZ 85226 and is currently estimated at $684,131, approximately $281 per square foot. 1277 N Hazelton Dr is a home located in Maricopa County with nearby schools including Kyrene del Cielo Elementary School, Kyrene Aprende Middle School, and Corona Del Sol High School.
Ownership History
Date
Name
Owned For
Owner Type
Purchase Details
Closed on
Nov 20, 2019
Sold by
Brien Pamela O
Bought by
Brien Pamela Ako O and The Pamela O Family Living Tru
Current Estimated Value
Home Financials for this Owner
Home Financials are based on the most recent Mortgage that was taken out on this home.
Original Mortgage
$260,000
Outstanding Balance
$228,275
Interest Rate
3.5%
Estimated Equity
$455,856
Purchase Details
Closed on
Nov 8, 2019
Sold by
Renner Ross A and Renner Holly L
Bought by
Brien Pamela O
Home Financials for this Owner
Home Financials are based on the most recent Mortgage that was taken out on this home.
Original Mortgage
$260,000
Outstanding Balance
$228,275
Interest Rate
3.5%
Estimated Equity
$455,856
Purchase Details
Closed on
Jul 12, 2013
Sold by
Renner Ross A
Bought by
Rener Ross A and Rener Holly L
Home Financials for this Owner
Home Financials are based on the most recent Mortgage that was taken out on this home.
Original Mortgage
$289,000
Interest Rate
2.87%
Mortgage Type
New Conventional
Purchase Details
Closed on
Jun 26, 2013
Sold by
Renner Holly L and Renner Ross A
Bought by
Renner Ross A
Home Financials for this Owner
Home Financials are based on the most recent Mortgage that was taken out on this home.
Original Mortgage
$289,000
Interest Rate
2.87%
Mortgage Type
New Conventional
Purchase Details
Closed on
Nov 25, 2003
Sold by
Tavitian David H and Tavitian Kevin
Bought by
Tavitian David H and Tavitian Kevin
Purchase Details
Closed on
Jul 30, 2003
Sold by
Renner Ross A and George Holly L
Bought by
Renner Ross A and Renner Holly L
Home Financials for this Owner
Home Financials are based on the most recent Mortgage that was taken out on this home.
Original Mortgage
$195,000
Interest Rate
5.13%
Mortgage Type
Balloon
Purchase Details
Closed on
Jan 12, 1999
Sold by
Rose Brian T and Rose Deanna Lynn
Bought by
Renner Ross A and George Holly L
Home Financials for this Owner
Home Financials are based on the most recent Mortgage that was taken out on this home.
Original Mortgage
$197,000
Interest Rate
6.66%
Mortgage Type
New Conventional
Purchase Details
Closed on
Oct 17, 1996
Sold by
Rose Brian T and Rose Deanna Lynn
Bought by
Rose Brian T and Rose Deanna Lynn
Purchase Details
Closed on
Oct 13, 1996
Sold by
Rose Brian T and Rose Deanna Lynn
Bought by
Rose Brian T and Rose Deanna Lynn
Purchase Details
Closed on
Aug 25, 1995
Sold by
Jackson Properties Ff Inc
Bought by
Jackson Properties Inc
Create a Home Valuation Report for This Property
The Home Valuation Report is an in-depth analysis detailing your home's value as well as a comparison with similar homes in the area
Home Values in the Area
Average Home Value in this Area
Purchase History
| Date | Buyer | Sale Price | Title Company |
|---|---|---|---|
| Brien Pamela Ako O | -- | Security Title Agency Inc | |
| Brien Pamela O | $477,500 | Security Title Agency Inc | |
| Rener Ross A | -- | Accommodation | |
| Renner Ross A | -- | Grand Canyon Title Agency In | |
| Tavitian David H | -- | Sun City Title Agency Co | |
| Del Webbs Coventry Homes Inc | -- | Sun Title Agency Co | |
| Renner Ross A | -- | -- | |
| Renner Ross A | $222,000 | Lawyers Title Of Arizona Inc | |
| Rose Brian T | -- | -- | |
| Rose Brian T | -- | -- | |
| Jackson Properties Inc | -- | Nations Title Insurance |
Source: Public Records
Mortgage History
| Date | Status | Borrower | Loan Amount |
|---|---|---|---|
| Open | Brien Pamela O | $260,000 | |
| Previous Owner | Renner Ross A | $289,000 | |
| Previous Owner | Renner Ross A | $195,000 | |
| Previous Owner | Renner Ross A | $197,000 |
Source: Public Records
Tax History Compared to Growth
Tax History
| Year | Tax Paid | Tax Assessment Tax Assessment Total Assessment is a certain percentage of the fair market value that is determined by local assessors to be the total taxable value of land and additions on the property. | Land | Improvement |
|---|---|---|---|---|
| 2025 | $3,050 | $38,286 | -- | -- |
| 2024 | $2,917 | $36,463 | -- | -- |
| 2023 | $2,917 | $49,920 | $9,980 | $39,940 |
| 2022 | $2,776 | $38,860 | $7,770 | $31,090 |
| 2021 | $2,928 | $36,780 | $7,350 | $29,430 |
| 2020 | $2,861 | $34,350 | $6,870 | $27,480 |
| 2019 | $2,777 | $32,920 | $6,580 | $26,340 |
| 2018 | $2,686 | $31,460 | $6,290 | $25,170 |
| 2017 | $2,560 | $30,830 | $6,160 | $24,670 |
| 2016 | $2,613 | $31,710 | $6,340 | $25,370 |
| 2015 | $2,411 | $28,870 | $5,770 | $23,100 |
Source: Public Records
Map
Nearby Homes
- 3683 W Barcelona Dr
- 3947 W Roundabout Cir
- 3424 W Thude Dr
- 1739 E Knox Rd
- 3580 W Dublin St
- 3165 W Golden Ln
- 991 N Florence Dr
- 1962 E Ranch Rd Unit 3
- 2007 E Ranch Rd
- 8856 S Taylor Dr
- 3111 W Baylor Ln
- 1966 E Calle de Arcos
- 3833 W Ivanhoe St
- 782 N Sicily Dr
- 1444 E Myrna Ln
- 802 N Butte Ave
- 2173 E La Vieve Ln
- 3930 W Monterey St Unit 108
- 4174 W Harrison St
- 1454 E Calle de Arcos
- 1285 N Hazelton Dr
- 1261 N Hazelton Dr
- 1301 N Tercera Ave
- 1260 N Hazelton Dr
- 1293 N Hazelton Dr
- 1245 N Hazelton Dr
- 1309 N Tercera Ave
- 1310 N Los Feliz Dr
- 3801 W Sheffield Ave
- 1244 N Hazelton Dr
- 1318 N Los Feliz Dr
- 1317 N Tercera Ave
- 3811 W Sheffield Ave
- 3680 W Golden Ln
- 3660 W Golden Ln
- 1326 N Los Feliz Dr
- 1325 N Tercera Ave
- 1308 N Hazelton Dr
- 3821 W Sheffield Ave
- 1231 N Tercera Ct