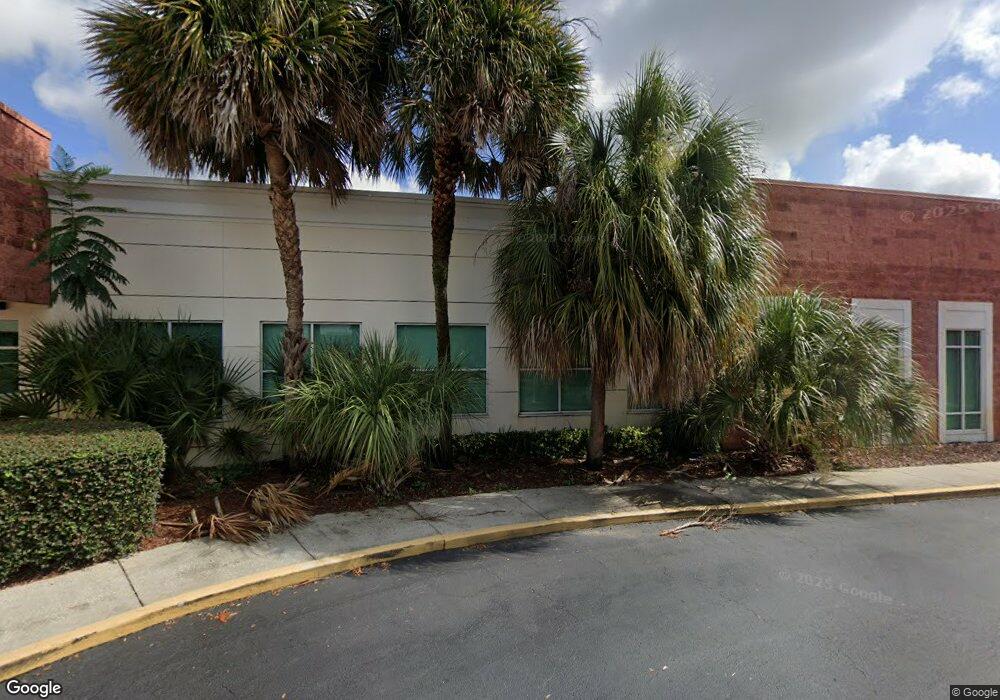
1277 N Semoran Blvd Unit 101 Orlando, FL 32807
Estimated Value: $6,772,214
--
Bed
--
Bath
20,308
Sq Ft
$333/Sq Ft
Est. Value
About This Home
This home is located at 1277 N Semoran Blvd Unit 101, Orlando, FL 32807 and is currently estimated at $6,772,214, approximately $333 per square foot. 1277 N Semoran Blvd Unit 101 is a home located in Orange County with nearby schools including Baldwin Park Elementary, Glenridge Middle, and Winter Park High.
Ownership History
Date
Name
Owned For
Owner Type
Purchase Details
Closed on
Jan 30, 2014
Sold by
1277 Semoran Llc
Bought by
Metro Eastwest Llc
Current Estimated Value
Purchase Details
Closed on
Aug 11, 2009
Sold by
Semoran Park Condominiums Llc
Bought by
1277 Semoran Llc
Purchase Details
Closed on
Jun 12, 2006
Sold by
Klekamp Cimmarron Inc
Bought by
Semoran Park Condominiums Llc
Home Financials for this Owner
Home Financials are based on the most recent Mortgage that was taken out on this home.
Original Mortgage
$3,187,500
Interest Rate
6.55%
Mortgage Type
Construction
Purchase Details
Closed on
Mar 25, 2004
Sold by
Icr Inc
Bought by
Klekamp Cimmarron Inc
Purchase Details
Closed on
Aug 9, 1999
Sold by
Reina Juan P
Bought by
I C R Inc
Create a Home Valuation Report for This Property
The Home Valuation Report is an in-depth analysis detailing your home's value as well as a comparison with similar homes in the area
Home Values in the Area
Average Home Value in this Area
Purchase History
| Date | Buyer | Sale Price | Title Company |
|---|---|---|---|
| Metro Eastwest Llc | $2,765,000 | Attorney | |
| 1277 Semoran Llc | $2,000,000 | Attorney | |
| Semoran Park Condominiums Llc | $3,750,000 | Attorney | |
| Klekamp Cimmarron Inc | $2,100,000 | -- | |
| I C R Inc | $30,000 | -- |
Source: Public Records
Mortgage History
| Date | Status | Borrower | Loan Amount |
|---|---|---|---|
| Previous Owner | Semoran Park Condominiums Llc | $3,187,500 | |
| Closed | 1277 Semoran Llc | $0 |
Source: Public Records
Tax History Compared to Growth
Tax History
| Year | Tax Paid | Tax Assessment Tax Assessment Total Assessment is a certain percentage of the fair market value that is determined by local assessors to be the total taxable value of land and additions on the property. | Land | Improvement |
|---|---|---|---|---|
| 2025 | $44,432 | $2,847,841 | $757,580 | $2,090,261 |
| 2024 | $46,171 | $2,745,205 | $721,505 | $2,023,700 |
| 2023 | $46,171 | $2,972,925 | $702,223 | $2,270,702 |
| 2022 | $43,797 | $2,808,584 | $668,947 | $2,139,637 |
| 2021 | $44,286 | $2,804,784 | $613,515 | $2,191,269 |
| 2020 | $38,978 | $2,553,844 | $613,515 | $1,940,329 |
| 2019 | $37,302 | $2,292,229 | $601,277 | $1,690,952 |
| 2018 | $36,545 | $2,219,022 | $572,481 | $1,646,541 |
| 2017 | $36,828 | $2,211,436 | $520,648 | $1,690,788 |
| 2016 | $35,682 | $2,097,501 | $505,530 | $1,591,971 |
| 2015 | $36,462 | $2,092,238 | $397,545 | $1,694,693 |
| 2014 | $25,977 | $1,466,288 | $397,545 | $1,068,743 |
Source: Public Records
Map
Nearby Homes
- 0 N SEMORAN BLVD N Semoran Blvd
- 1310 Coletta Dr
- 1206 Coletta Dr
- 1427 N Semoran Blvd
- 5525 Barma St
- 1433 Kingston Ave
- 5851 Cornelia Ave
- 5216 Sunrise Blvd
- 6117 Cornelia Ave
- 5416 Penway Dr
- 0 N Semoran Blvd Unit MFRS5118983
- 5356 Penway Dr
- 5476 Penway Dr
- 694 Golden Sunshine Cir
- 1225 Susannah Blvd
- 706 Golden Sunshine Cir
- 1614 Almond Ave
- 717 Golden Sunshine Cir
- 4892 Beach Blvd
- 5380 Barton Dr
- 1277 N Semoran Blvd Unit 118
- 1277 N Semoran Blvd
- 1287 N Semoran Blvd Unit 300
- 1287 N Semoran Blvd Unit 100
- 1276 N Semoran Blvd
- 1222 Myrtle St
- 1312 Myrtle St
- 1245 Myrtle St
- 1231 Myrtle St
- 1214 Myrtle St
- 1314 Myrtle St
- 1301 Myrtle St
- 1252 N Semoran Blvd
- 1223 Myrtle St
- 1309 Myrtle St
- 1300 N Semoran Blvd
- 1239 Myrtle St
- 1222 N Semoran Blvd
- 1217 Myrtle St
- 1242 Coletta Dr