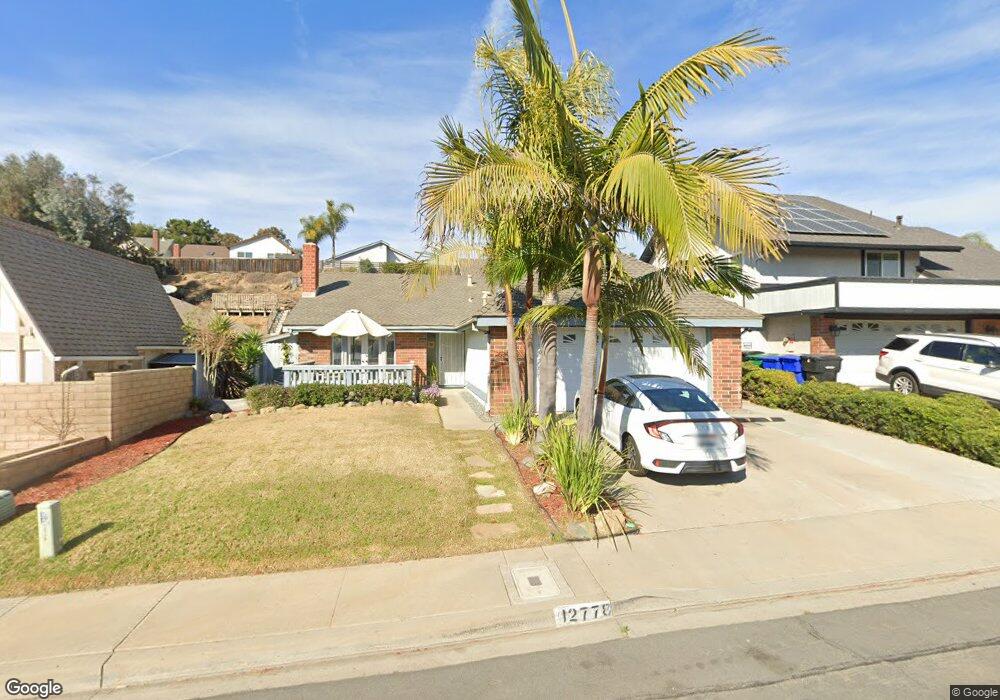
12778 Mengibar Ave San Diego, CA 92129
Rancho Peñasquitos NeighborhoodEstimated Value: $1,143,000 - $1,448,000
4
Beds
3
Baths
1,888
Sq Ft
$702/Sq Ft
Est. Value
About This Home
This home is located at 12778 Mengibar Ave, San Diego, CA 92129 and is currently estimated at $1,325,912, approximately $702 per square foot. 12778 Mengibar Ave is a home located in San Diego County with nearby schools including Canyon View Elementary School, Mesa Verde Middle School, and Westview High School.
Ownership History
Date
Name
Owned For
Owner Type
Purchase Details
Closed on
May 23, 2013
Sold by
Hellman Tracy D and Hellman Susan E
Bought by
Hellman Tracy D and Hellman Susan E
Current Estimated Value
Home Financials for this Owner
Home Financials are based on the most recent Mortgage that was taken out on this home.
Original Mortgage
$140,000
Interest Rate
3.38%
Mortgage Type
New Conventional
Purchase Details
Closed on
May 17, 2013
Sold by
Hellman Tracy D and Hellman Susan E
Bought by
Hellman Tracy D and Hellman Susan E
Home Financials for this Owner
Home Financials are based on the most recent Mortgage that was taken out on this home.
Original Mortgage
$140,000
Interest Rate
3.38%
Mortgage Type
New Conventional
Purchase Details
Closed on
Dec 17, 2004
Sold by
Hellman Tracy D and Hellman Susan E
Bought by
Hellman Tracy D and Hellman Susan E
Purchase Details
Closed on
Jun 15, 1999
Sold by
Brian Gorter
Bought by
Hellman Tracy Douglas and Hellman Susan Elizabeth
Home Financials for this Owner
Home Financials are based on the most recent Mortgage that was taken out on this home.
Original Mortgage
$184,000
Interest Rate
7.24%
Mortgage Type
Stand Alone First
Purchase Details
Closed on
Aug 3, 1993
Create a Home Valuation Report for This Property
The Home Valuation Report is an in-depth analysis detailing your home's value as well as a comparison with similar homes in the area
Home Values in the Area
Average Home Value in this Area
Purchase History
| Date | Buyer | Sale Price | Title Company |
|---|---|---|---|
| Hellman Tracy D | -- | Accommodation | |
| Hellman Tracy D | -- | Lsi | |
| Hellman Tracy D | -- | -- | |
| Hellman Tracy Douglas | $230,000 | First American Title Ins Co | |
| -- | $188,400 | -- |
Source: Public Records
Mortgage History
| Date | Status | Borrower | Loan Amount |
|---|---|---|---|
| Closed | Hellman Tracy D | $140,000 | |
| Closed | Hellman Tracy Douglas | $184,000 |
Source: Public Records
Tax History Compared to Growth
Tax History
| Year | Tax Paid | Tax Assessment Tax Assessment Total Assessment is a certain percentage of the fair market value that is determined by local assessors to be the total taxable value of land and additions on the property. | Land | Improvement |
|---|---|---|---|---|
| 2025 | $4,636 | $421,809 | $97,072 | $324,737 |
| 2024 | $4,636 | $413,539 | $95,169 | $318,370 |
| 2023 | $4,535 | $405,431 | $93,303 | $312,128 |
| 2022 | $4,456 | $397,482 | $91,474 | $306,008 |
| 2021 | $4,396 | $389,689 | $89,681 | $300,008 |
| 2020 | $4,336 | $385,694 | $88,762 | $296,932 |
| 2019 | $4,222 | $378,132 | $87,022 | $291,110 |
| 2018 | $4,102 | $370,718 | $85,316 | $285,402 |
| 2017 | $3,990 | $363,450 | $83,644 | $279,806 |
| 2016 | $3,907 | $356,324 | $82,004 | $274,320 |
| 2015 | $3,847 | $350,973 | $80,773 | $270,200 |
| 2014 | $3,756 | $344,099 | $79,191 | $264,908 |
Source: Public Records
Map
Nearby Homes
- 9562 Benavente St
- 12940 Calle de Las Rosas
- 12979 Calle de Las Rosas
- 10202 Vista Lusardi Unit LOT 9
- Plan 1 at Paseo Sereno
- Plan 2 at Paseo Sereno
- Plan 3 at Paseo Sereno
- 12811 Encantadora Unit 32
- 13113 Calle de Las Rosas
- 12727 Calle de Las Rosas
- 10740 Sabre Hill Dr Unit 120
- 10776 Sabre Hill Dr Unit 150
- 9959 Azuaga St Unit 105
- 10756 Sabre Hill Dr Unit 265
- 10824 Sabre Hill Dr Unit 194
- 9819 Kika Ct
- 9720 Graceland Way
- 9525 Vervain St
- 9525 High Park Ln
- 13015 Evening Creek Dr S Unit 18
- 12784 Mengibar Ave
- 12772 Mengibar Ave
- 12766 Mengibar Ave
- 9787 Benavente Place
- 9777 Benavente Place
- 12764 Cijon St
- 9767 Benavente Place
- 12760 Mengibar Ave
- 12743 Mengibar Ave
- 12793 Cijon St
- 9757 Benavente Place
- 12777 Cijon St
- 12783 Cijon St
- 12756 Cijon St
- 12773 Cijon St
- 12797 Cijon St
- 12754 Mengibar Ave
- 12787 Cijon St
- 12737 Mengibar Ave
- 12767 Cijon St